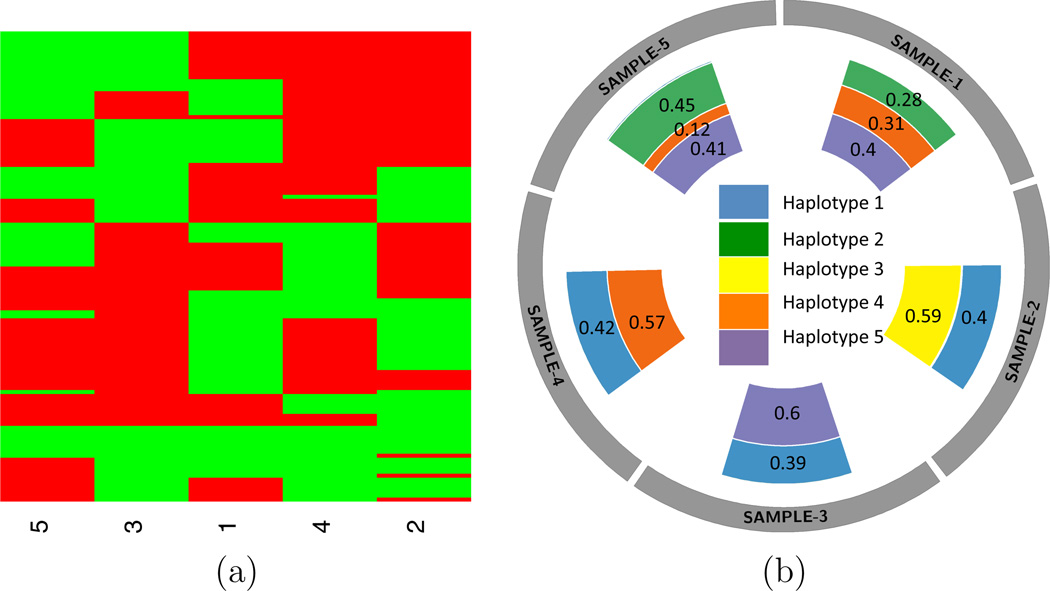
Figure 6.
Summary of TH analysis using the PDAC data with 118 SNVs. (a): Posterior estimated haplotype genotypes (columns) of the selected SNVs. Five haplotypes are identified. A green/red block indicates a mutant/wildtype allele at the SNV in the haplotype. (b): A circos plot showing the estimated proportion ŵtc with Ĉ = 5 haplotypes.

