Figure 3.
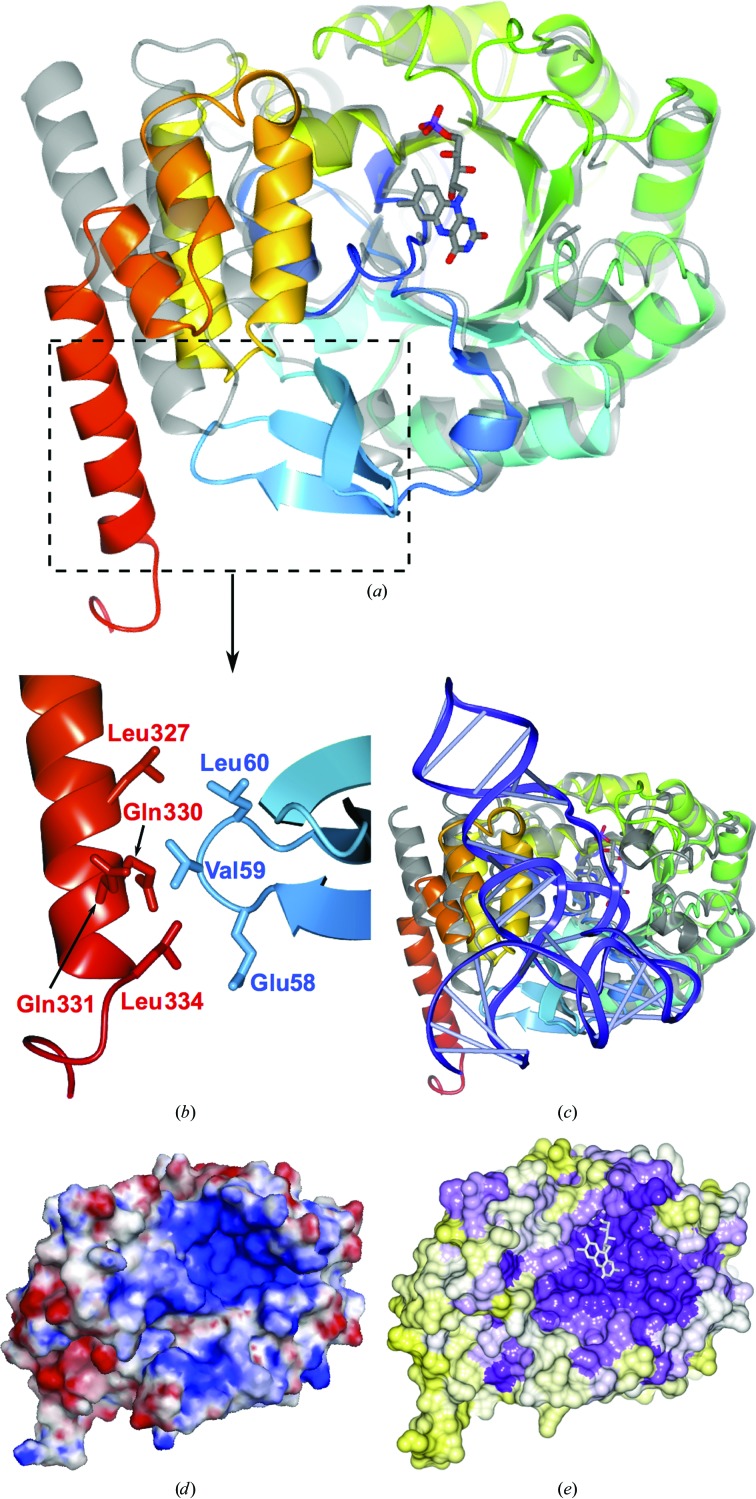
Comparison of hDus2 with TtDus and analysis of electrostatic surface and sequence conservation. (a) Ribbon diagram showing superposition of hDus2 with TtDus (grey). The boxed area is magnified in (b), showing hDus2 interactions between the catalytic and recognition domains that are not present in bacterial Dus enzymes. (c) hDus2 superposed with the structure of the TtDus–tRNA complex (with TtDus in grey and tRNA in blue). (d) hDus2 molecular surface coloured according to electrostatic potential (±5kT/e; red, negative; blue, positive). (e) hDus2 surface coloured according to sequence conservation: high (purple) to low (yellow).

