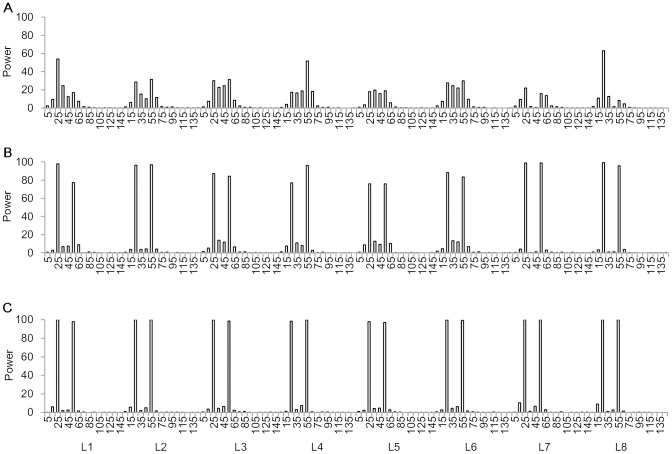
Fig 6. Power analysis by marker interval of chromosome 1 for the linked QTL model.
(A) H 2 = 0.1. (B) H 2 = 0.5. (C) H 2 = 0.8. Power was calculated as the proportion of runs where QTL on the interval was detected. There were 15 marker intervals defined by the 16 markers evenly distributed on chromosome 1. Power on other chromosomes were close to zero on chromosomes 2 to 6 where no QTL was predefined.

