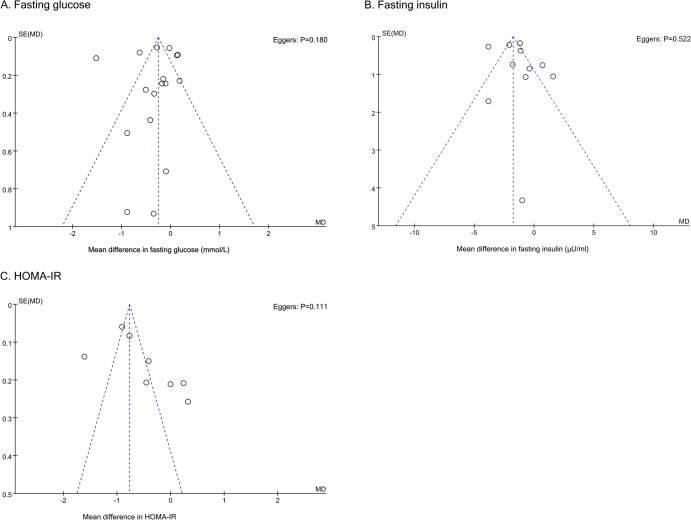
Fig 6. Publication bias funnel plots.
Publication bias funnel plots for fasting glucose (A), fasting insulin (B) and HOMA-IR (C). The solid line represents the pooled effect estimate expressed as the weighted mean difference for each analysis. The dashed lines represent pseudo-95% confidence limits. P-values displayed in the top right corner of each funnel plot are derived from quantitative assessment of publication bias by Egger’s test.

