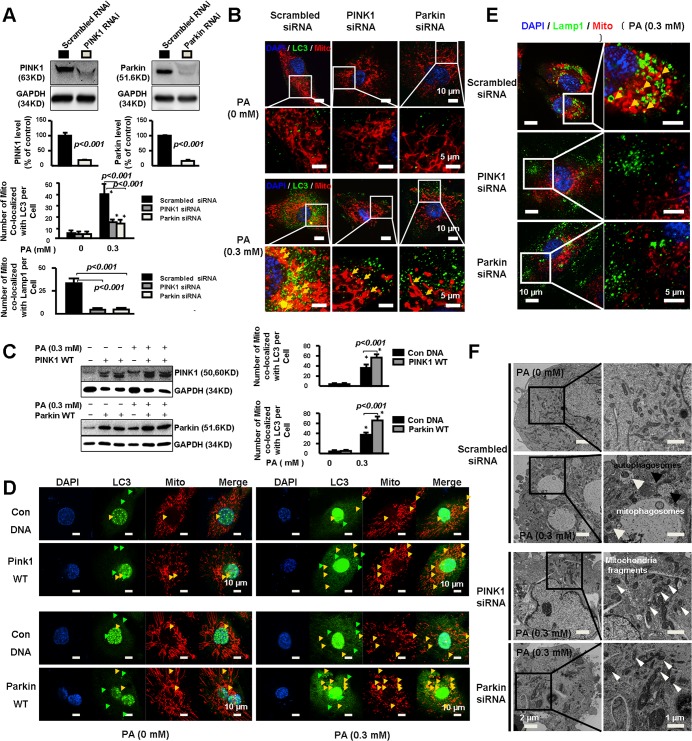
Fig 2. PINK1 and Parkin were involved in mitophagy in PA-treated cells.
A. HAECs were transfected with PINK1 or Parkin siRNA followed by treatment with PA for 24 hours. Representative western blots and quantitative analysis of 3 independent experiments showed successful silencing of PINK1 and Parkin. B. Representative immunostaining images and quantitative analysis of 3 independent experiments showed that PINK1 or Parkin siRNA reduced the number of mitochondria co-localized with LC3 per cell. At least 25–30 cells per condition were analyzed. *P< 0.001 vs. PA (0mM). C. HAECs were transfected with PINK1 or Parkin or control plasmid followed by treatment with PA for 48 hours. Representative western blot of 3 independent experiments showed successful overexpression of PINK1 and Parkin. D. Representative immunostaining and quantitative analysis of 3 independent experiments showed PA induced LC3 expression and the number of mitochondria co-localized with LC3 per cell which was markedly increased by overexpression of PINK1 or Parkin. At least 25–30 cells per experiment were analyzed. *P< 0.001 vs. PA (0mM). E. Representitive immunostaining and quantitative analysis of 3 independent experiments show that silencing PINK1 or Parkin partially prevented PA induced mitochondria co-localized with Lamp1. At least 25–30 cells per experiment were analyzed. F. Representative electron microscopy photomicrographs show decreased mitophagy with increased mitochondria fragments in PINK1 or Parkin deficient cells. Black arrows indicated autophagosomes, white arrows indicated mitophagosomes and arrowheads indicated mitochondria fragments.

