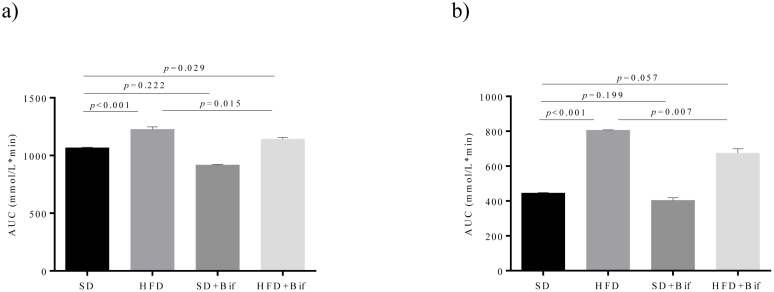
Fig 1. Oral glucose tolerance (a) and insulin sensitivity (b) in different mouse groups after 14 weeks of dietary intervention.
SD group: control mice receiving a standard diet (SD) plus placebo; HFD group: obese mice receiving a high-fat diet (HFD) plus placebo; SD+Bif group: control mice receiving SD and a daily dose of 1 x 10⁹ CFU B. pseudocatenulatum CECT 7765; HFD+Bif group: obese mice receiving HFD and a daily dose of 1 x 10⁹ CFU B. pseudocatenulatum CECT 7765 by gavage during 14 weeks (n = 10). Data are expressed as means of area under curve (AUC) from the plots of glucose concentration (mmol/L) versus time (min) (standard errors in bars). Statistically significant differences were determined by ANOVA with Bonferroni’s post hoc test a p< 0.050.

