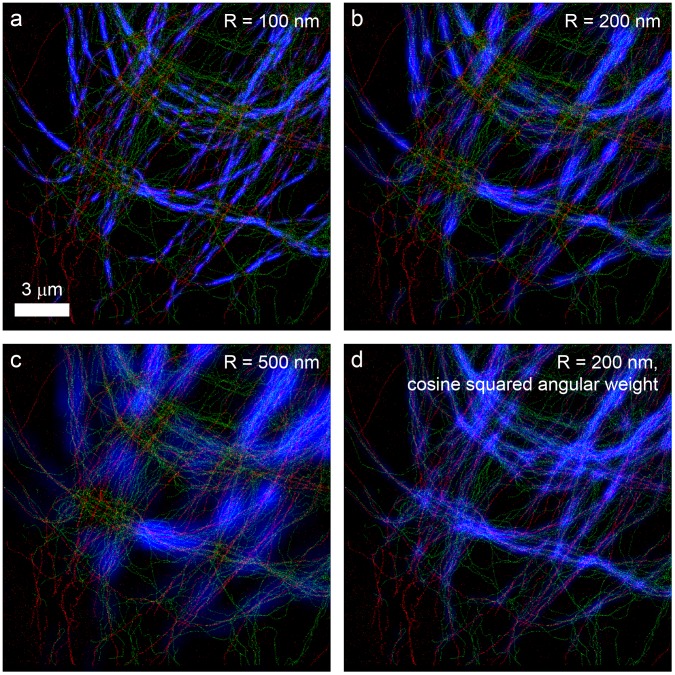
Fig 6. Visualization of the local co-orientation strength.
(a-c) Localization microscopy images of tubulin (red) and vimentin (green). Blue overlays show the local co-orientation strength K ∥(R) in order to highlight the regions with the strongest local co-orientation. Increasing R causes more filaments that are further apart from each other to contribute to K ∥(R), but also causes K ∥(R) to appear less localized. (d) The same image as (b), but with the cos(2ϕ) weight in the computation of K ∥(R) in Eq 7 replaced by a cos2(ϕ) weight. This provides a visualization in which crossing filaments do not cancel the contributions to the local co-orientation strength of parallel filaments. However, this visualization is also sensitive to regions with mere co-localization where filaments are not aligned.

