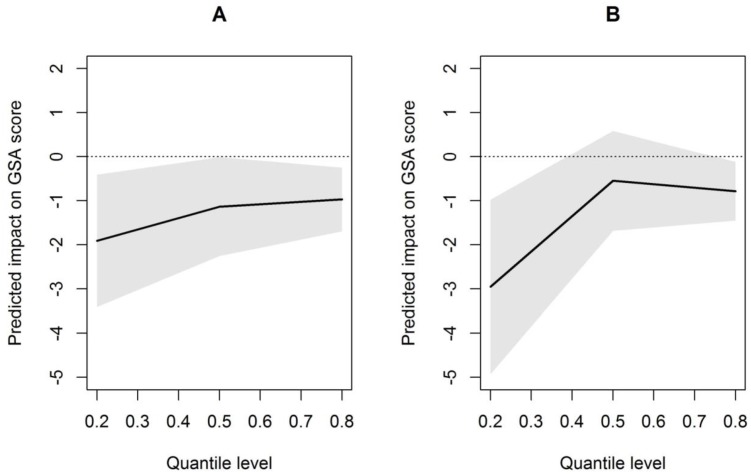
Fig 3. Association between the urbanicity of the residence and the GSA score at age five using model 3.
The x-axis represents the quantile level (e.g., 0.2 = 20th percentile) of the GSA score and the y-axis represents the corresponding estimated impact of the level of urbanicity on the GSA score compared to the residence (Panel A: quasi-rural residence, Panel B: urban residence). Panels A-B show the results from a mixed quantile model adjusted for child and parent/family characteristics (model 3). The dotted lines represent pointwise 95 percent confidence intervals.

