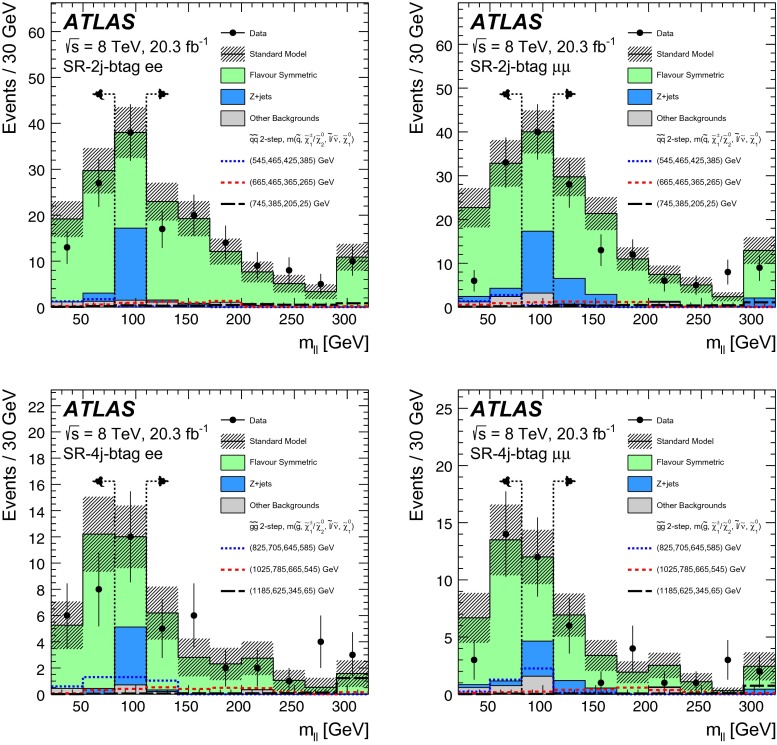
Fig. 10.
The observed and expected dilepton mass distributions in the SR-2j-btag (top) and SR-4j-btag (bottom) signal regions of the off-Z search. The vertical dashed lines indicate the region, which is used to normalise the background and is thus not treated as a search region. Example signal models of squark- or gluino-pair production (dashed lines) are overlaid, with , , , and of each benchmark point being indicated in the figure legend. The last bin contains the overflow. All uncertainties are included in the hatched uncertainty band

