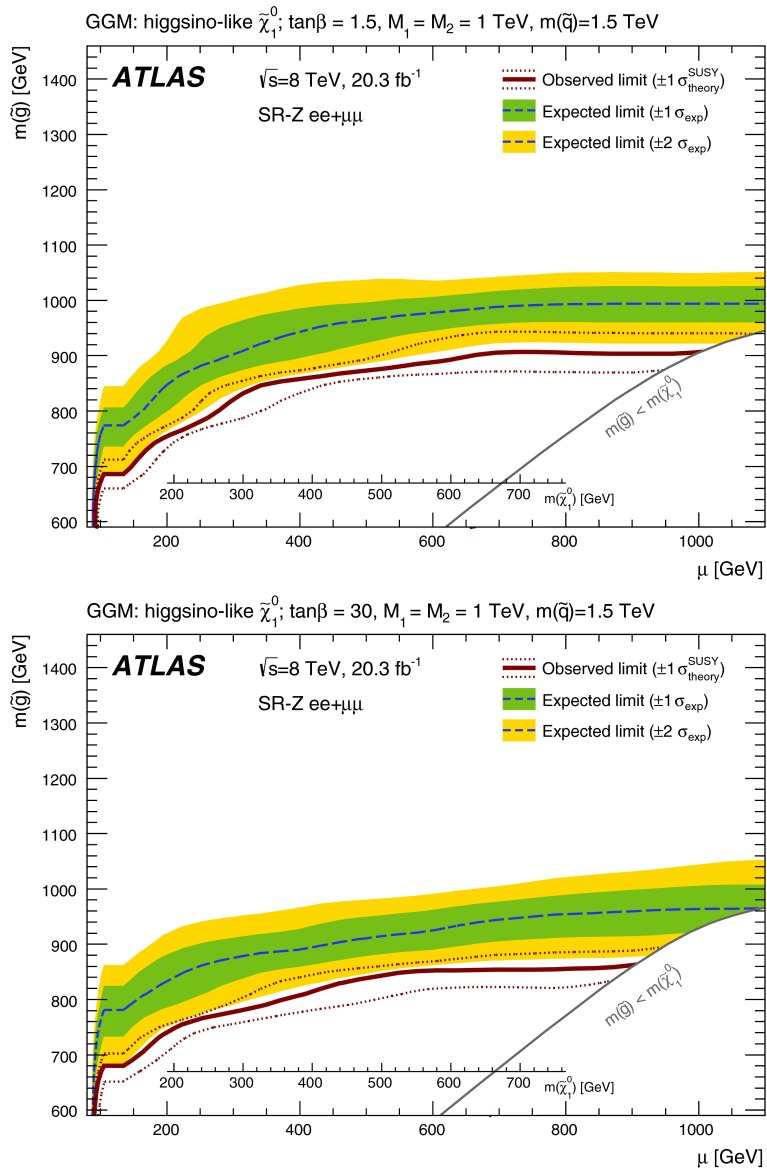
Fig. 12.
The 95 % CL exclusion limit from the on-Z combined same-flavour channels in the versus plane in the GGM model with (top) and (bottom). The dark blue dashed line indicates the expected limits at 95 % CL and the green (yellow) bands show the () variation on the expected limit as a consequence of the experimental and theoretical uncertainties on the background prediction. The observed limits are shown by the solid red lines, with the dotted red lines indicating the limit obtained upon varying the signal cross section by . The region below the grey line has the gluino mass less than the lightest neutralino mass and is hence not considered. The value of the lightest neutralino mass is indicated by the x-axis inset

