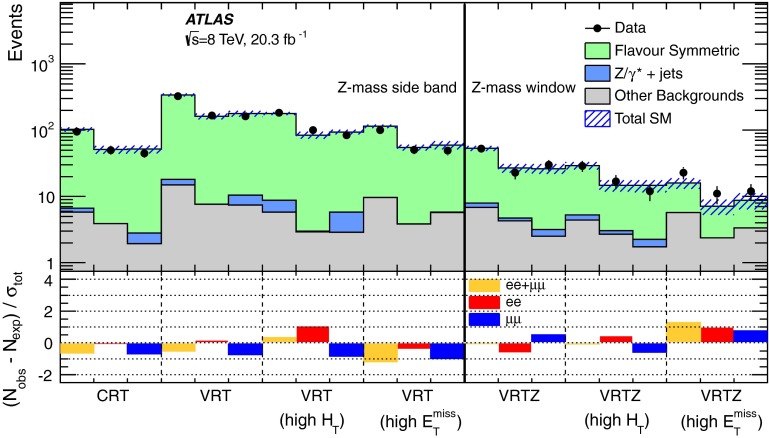
Fig. 4.
The observed and expected yields in CRT and the VRs in the Z boson mass sidebands (left) and the Z boson mass window (right) regions. The bottom plot shows the difference in standard deviations between the observed and expected yields. The backgrounds due to WZ, ZZ or rare top processes, as well as from lepton fakes, are included under “Other Backgrounds”

