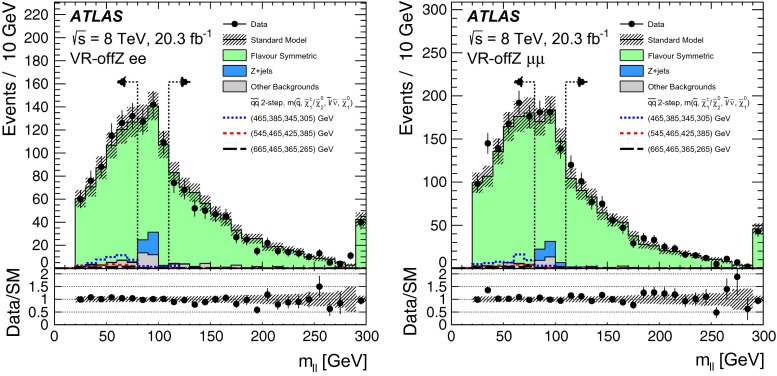
Fig. 5.
The observed and expected dilepton mass distributions in the electron (left) and muon (right) channel of the validation region (VR-offZ) of the off-Z search. Data (black points) are compared to the sum of expected backgrounds (solid histograms). The vertical dashed lines indicate the region, which is used to normalise the background. Example signal models (dashed lines) are overlaid, with , , , and of each benchmark point being indicated in the figure legend. The bottom plots show the ratio of the data to expected background. The error bars indicate the statistical uncertainty in data, while the shaded band indicates the total background uncertainty. The last bin contains the overflow

