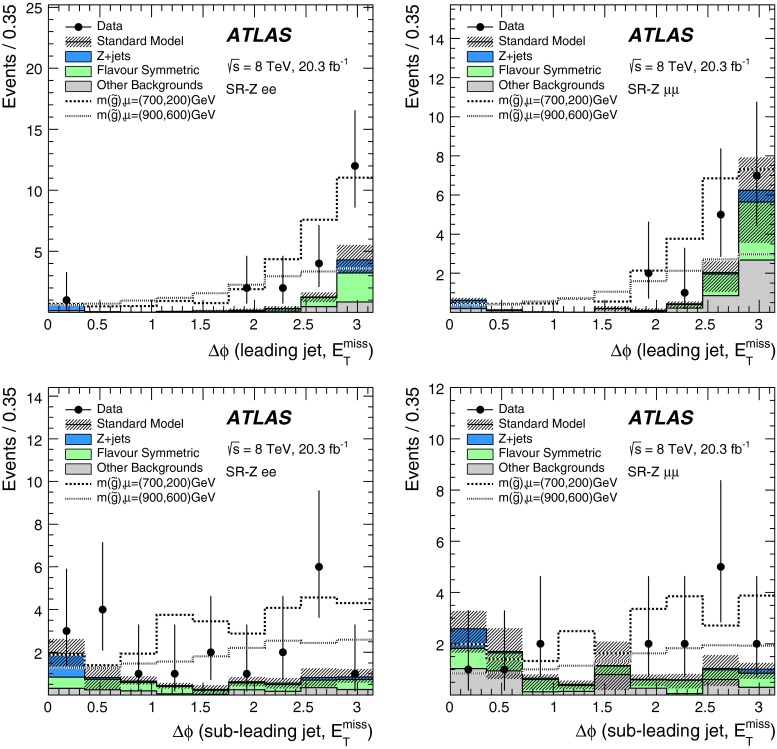
Fig. 8.
The distribution of the between the leading jet and (top) and the sub-leading jet and (bottom) for the electron (left) and muon (right) channel in the on-Z SRs before having applied the requirement . All uncertainties are included in the hatched uncertainty band. Two example GGM () signal models are overlaid. The backgrounds due to WZ, ZZ or rare top processes, as well as from fake leptons, are included under “Other Backgrounds”

