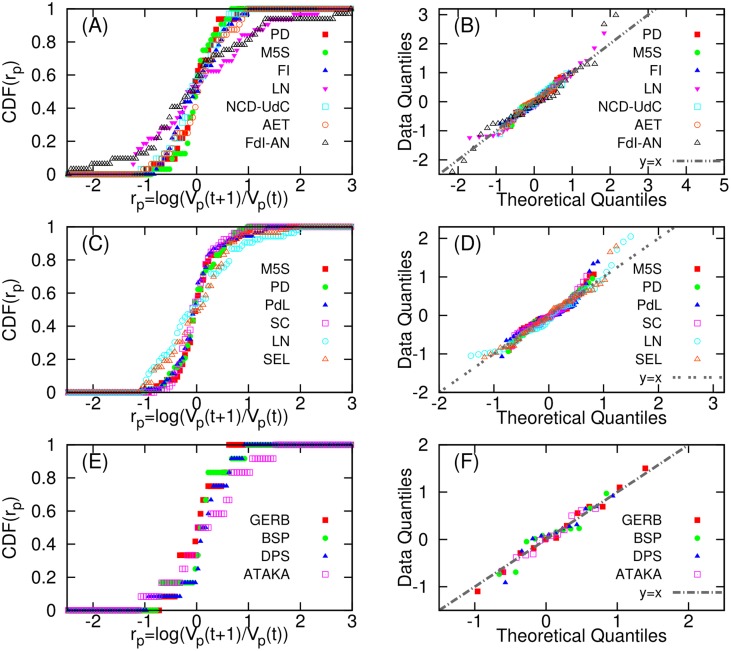
Fig 4. Normality of the logarithmic ratio r p(t) = log(V p(t + 1)/V p(t)) of two consecutive tweet volumes of party p.
Cumulative distribution functions of the log ratio for each party are represented in (A) Euro14. (C)Italy13. (E) Bulgaria13. The Q-Q plots of the log ratio r(t) for each party are also represented in (B)Euro14. (D) Italy13. (F) Bulgaria13. The theoretical quantile is based on normal distribution. In the Q-Q plot, if the points lie on y = x, it means the log ratio follow a normal distribution.

