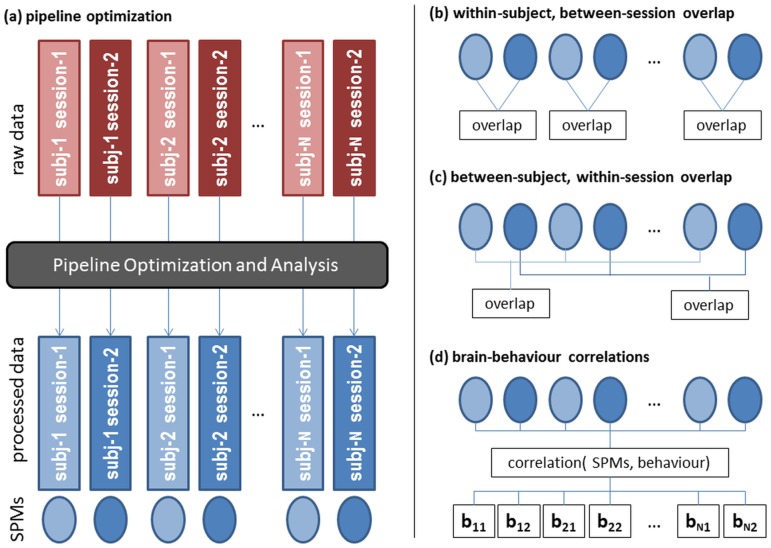
Fig 1. The pipeline optimization and validation procedure of this paper.
This schematically represents the approach to pipeline optimization, and independent validation measures used to test the quality of optimized results. (a) for all subjects and each of the three tasks, we have raw data from two scanning sessions (i.e. test and retest) in red. For each task run and session, we identify the optimal pipeline based on measures of prediction and reproducibility (P, R), and output optimally preprocessed data (blue) and an analysis SPM. (b-d) cross-validation measures, computed on SPMs of independently-optimized datasets. (b) activation overlap between SPMs of the two scanning sessions, within each subject. (c) activation overlap between subject SPMs, within a single scanning session. (d) correlation between SPM activity and independent behavioural measures (bij = subject i, session j), measured via Partial Least Squares analysis.

