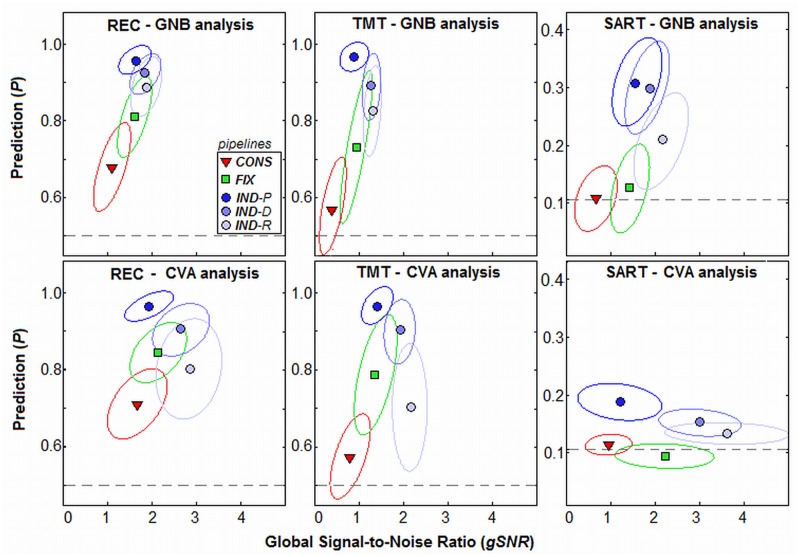
Fig 3. Prediction and global Signal-to-Noise Ratio for different preprocessing pipelines.
Pipelines include a standard conservative pipeline (CONS), fixed optimization (FIX), and individual optimization maximizing prediction (IND-P), reproducibility (IND-R) or both metrics (IND-D). Each point shows average (gSNR, P) coordinates, for a different experimental task and analysis model, with ±1 Standard Deviation ellipses (enclosing ~68% of data points). Dashed lines indicate chance (random guessing) for prediction. Tasks include: Recognition (REC), Trail-Making Test (TMT) and Sustained Attention to Response Task (SART). Analysis models include: univariate Gaussian Naïve Bayes (GNB) and multivariate Canonical Variates Analysis (CVA). To see individual subject (gSNR, P) values, see S1 Fig.

