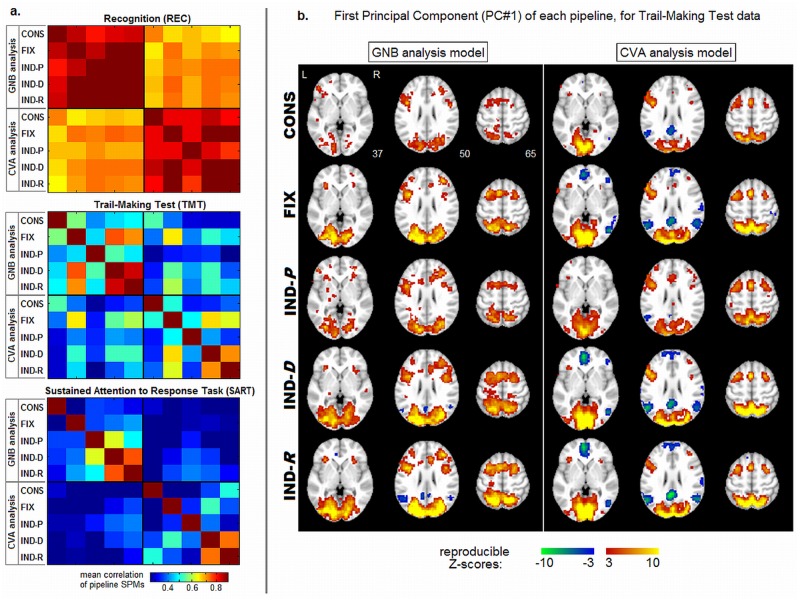
Fig 4. Spatial brain pattern similarity between preprocessing pipelines.
(a) average correlation between pipeline SPMs, for Recognition (REC), Trail-Making Test (TMT) and Sustained Attention to Response Task (SART). Pipelines include: conservative (CONS) and optimal fixed (FIX), along with individually optimized pipelines based on prediction (IND-P), reproducibility (IND-R), and both metrics (IND-D); results are shown for univariate GNB analysis and multivariate CVA analysis. (b) the first Principal Component of subject SPMs for a representative TMT task, with GNB and CVA across five different preprocessing pipelines; these are the most stable spatial patterns across subjects. SPMs are Z-scored using a cross-validation procedure (Optimization Metrics), and thresholded at False-Discovery Rate FDR = .05 to correct for multiple comparisons.

