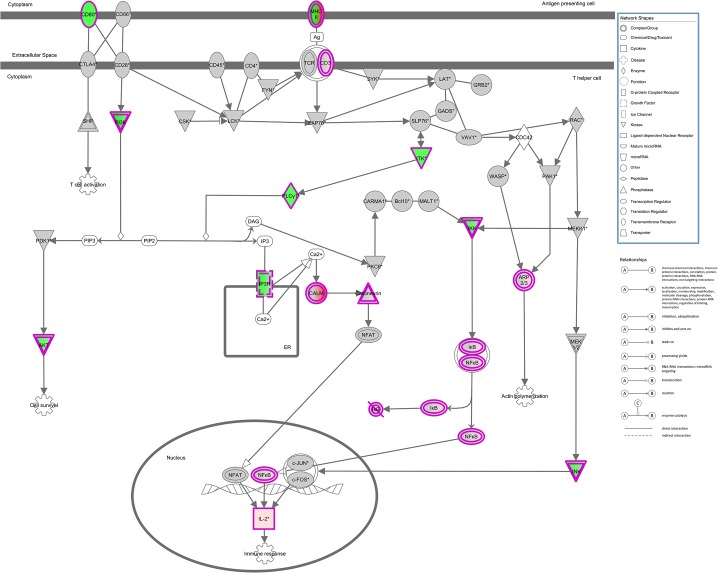
Fig 3. Canonical pathway for CD28 Signaling in T Helper Cells overlaid with hits from union of RIP-Seq and RNA-Seq analyses.
Significant pathway nodes are shaded according to size of fold change (red >1; green <1), with white nodes indicating genes that were not detected in the samples and gray indicating genes that were detected, but not significant. Nodes with multicolor gradients denote nodes with significant genes with fold changes in different directions (see Table 3 for more details). Fold change is defined as KO/CTL (RNA-Seq) or IP/CTL (RIP-Seq). Colored double borders indicate that the molecule is a complex.

