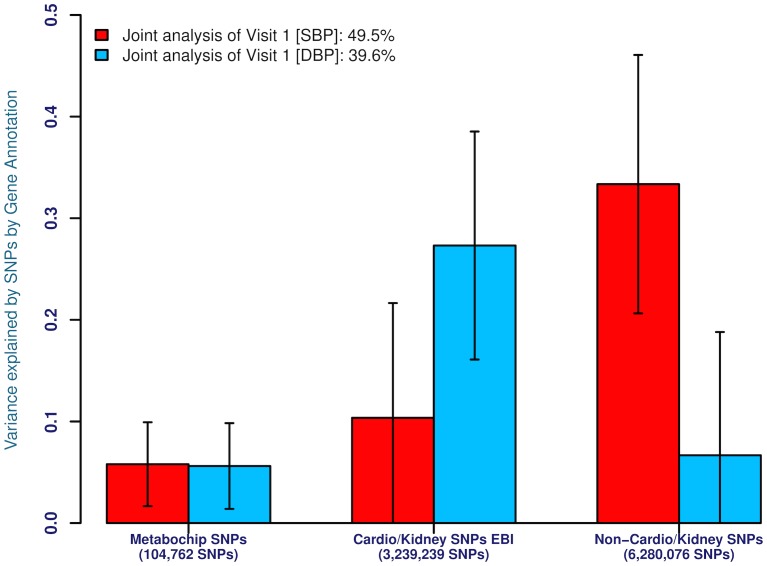
Fig 3.
(a) Proportion of the genetic variance explained by SNPs for SBP and DBP for genotyped and imputed SNPs within known gene annotations (Metabochip SNPs = Markers associated with metabolic traits; Cardio/Kidney SNPs EBI = Markers associated with cardiovascular traits annotated by EBI; Non-Cardio/Kidney SNPs = Markers with no known association with cardiovascular or renal tissue) in 8,901 EA individuals. The trait analyzed is first-visit SBP and DBP with analyses for genotyped and imputed SNPs, (b) Legend as in (a) but for 2,860 AA individuals.

