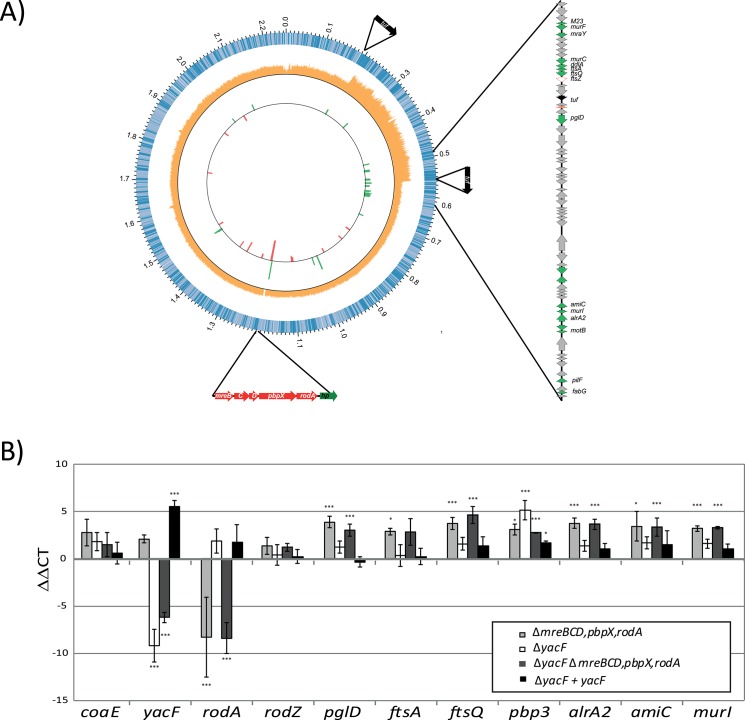
Fig 8. Cellular adaptation to artificial coccoïd transition.
A) A graphical representation of the N. elongata genome sequenced by PacBio is illustrated here using CIRCOS software. The first circle represents the different orf and their orientation. The second circle represents the coverage values (orange) of the Illumina reads obtain by sequencing N. elongata ΔmreBCD,pbpX,rodA and mapped along the genome of N. elongata wild-type. One can notice the increased coverage by two fold of the DNA region from 0.202 to 0.558 Mbp. Finally, the third internal circle represent the fold change expression, in function of the position, of genes up-regulated (green) and down-regulated (red) of ΔmreBCD,pbpX,rodA compare to wild type N. elongata. Only genes with a p-value below 0.01 and fold change over 3 are represented. All the fold change values and statistics are presented in S3 Table. B) Verification of transcriptional changes of selected genes, in the different mutants, using rt-PCR and calculated using ΔΔCT (*** p≤0.001; ** p≤0.01; * p≤0.05).

