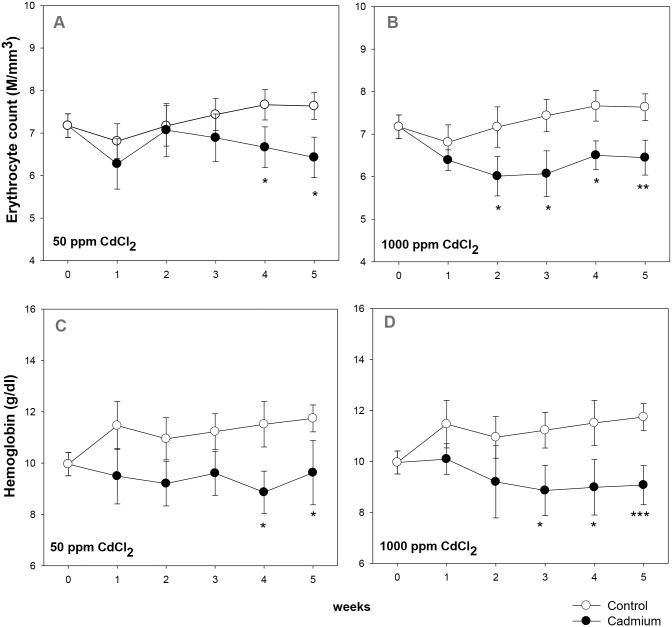
Fig 1. Kinetics of induction of anemia in cadmium treated mice.
Mice were given cadmium chloride dissolved in drinking water (50 ppm and 1000 ppm). Blood samples from mice in control and cadmium-treated groups were collected at different time points and analyzed on an automated cell counter. Erythrocyte count and hemoglobin content in 50 ppm group over a period of 6 weeks are given in panels A and C respectively (ANOVA test for effect of cadmium on erythrocyte count, p = 0.057; on hemoglobin level p<0.001). Erythrocyte count and hemoglobin content at different time intervals in mice exposed to 1000 ppm of cadmium chloride have been shown in panels B and D respectively (ANOVA test for effect of cadmium on erythrocyte count, p = 0.001; on hemoglobin level p<0.001). Each point on the graph represents mean ± SEM of observations on 10–15 mice. *p<0.05, **p<0.01 and ***p<0.005 for comparison of the groups (Student t-test).

