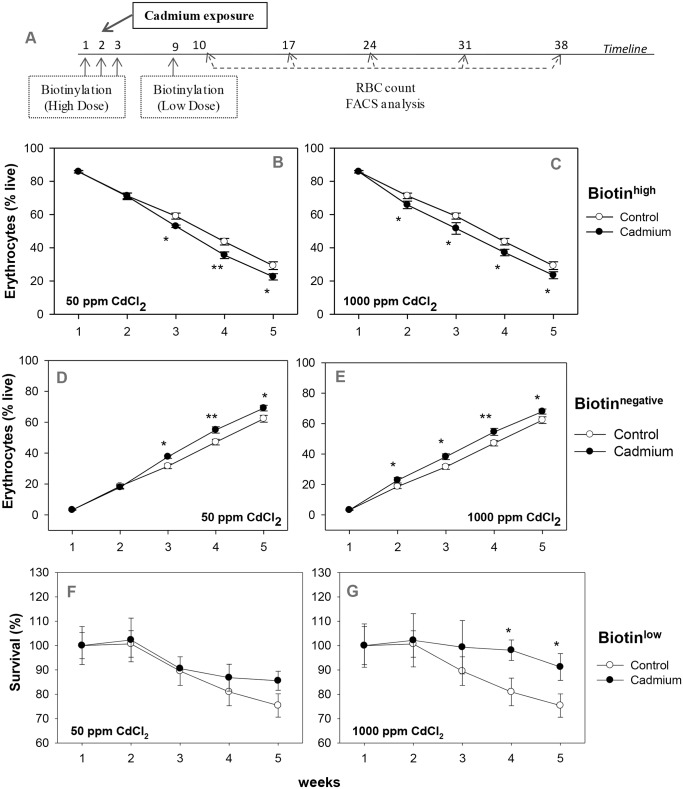
Fig 2. Erythrocyte turnover in the blood of control and cadmium-treated mice.
Mice were given cadmium chloride dissolved in drinking water (50 ppm and 1000 ppm). Mouse erythrocytes were labeled with biotin in vivo by the two step biotinylation procedure. The experimental protocol is given in panel A. The first biotinylation injection coincided with the onset of exposure of cadmium. After the 2nd biotinylation step, blood samples were collected at weekly intervals. Erythrocytes were stained ex vivo with Streptavidin-APC and proportions of the different age cohorts were determined. Turnover profile of biotinhigh (panels B, C) and biotinnegative (panels D, E) erythrocytes in mice exposed to 50 ppm (panels B, D; ANOVA test for cadmium p = 0.004 in both biotinhigh and biotinnegative erythrocytes) and 1000 ppm (panels C, E; ANOVA test for cadmium p<0.001 in both biotinhigh and biotinnegative erythrocytes) of cadmium chloride have been shown. Relative survival of the biotinlow erythrocytes in control and cadmium treated mice is given in panels F and G (for 50 ppm and 1000 ppm of cadmium chloride exposure respectively). For this, proportion of biotinlow erythrocytes on the 1st time point in each group was taken as 100 and their proportion at later time points were depicted in relative terms. ANOVA test for effect of cadmium on the relative survival of biotinlow erythrocytes in the 3–5 week time point, p = 0.32 (not significant) for 50 ppm group (panel F) and p = 0.008 for 1000 ppm group (panel G). Each point on the graph represents mean ± SEM of observations on 10–15 mice. *p<0.05 and **p<0.01 for comparison of the groups (Student t-test).

