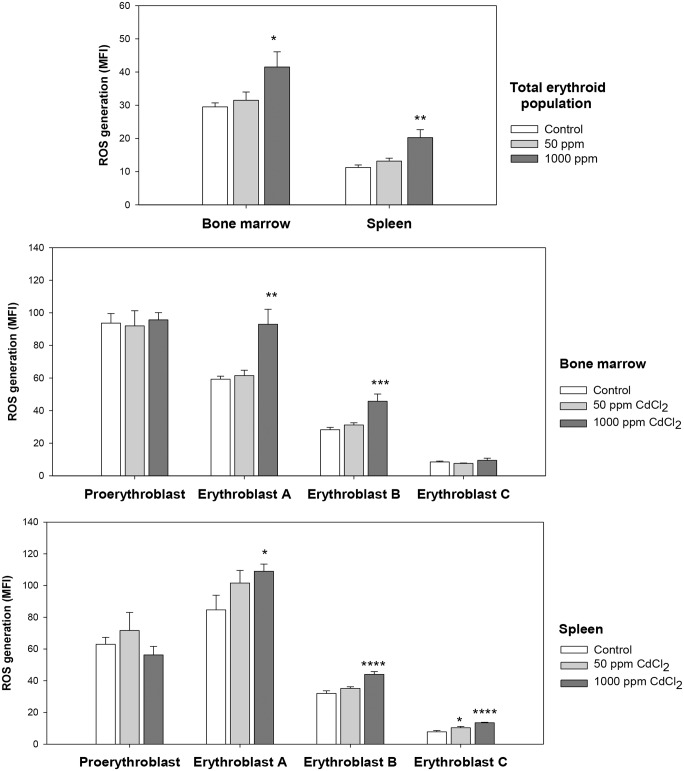
Fig 8. ROS generation in maturational stages of erythroid differentiation in bone marrow and spleen.
Mice were given cadmium chloride dissolved in drinking water (50 ppm and 1000 ppm). Mice were sacrificed and their bone marrow and spleen cells were harvested. Cells isolated from mice bone marrow and spleen were stained with PE-anti-mouse CD71, APC-anti-mouse Ter119 and CMH2DCFDA. Different maturational stages of erythropoiesis were determined by relative Ter119/CD71/FSC expression, and the ROS generation in each of these stages was estimated by CMH2DCFDA staining. Relative ROS generation has been shown as mean fluorescence intensity (MFI) in total erythroid population (panel A) and in different maturational stages of erythroid differentiation in bone marrow (panel B) and spleen (panel C) in mice after 5 weeks of cadmium exposure. Each bar in the graph represents mean ± SEM of observations on 5 mice. *p<0.05, **p<0.01, ***p<0.005 and ****p<0.001 for comparison of the groups. Statistical analysis was done using Student t-test.

