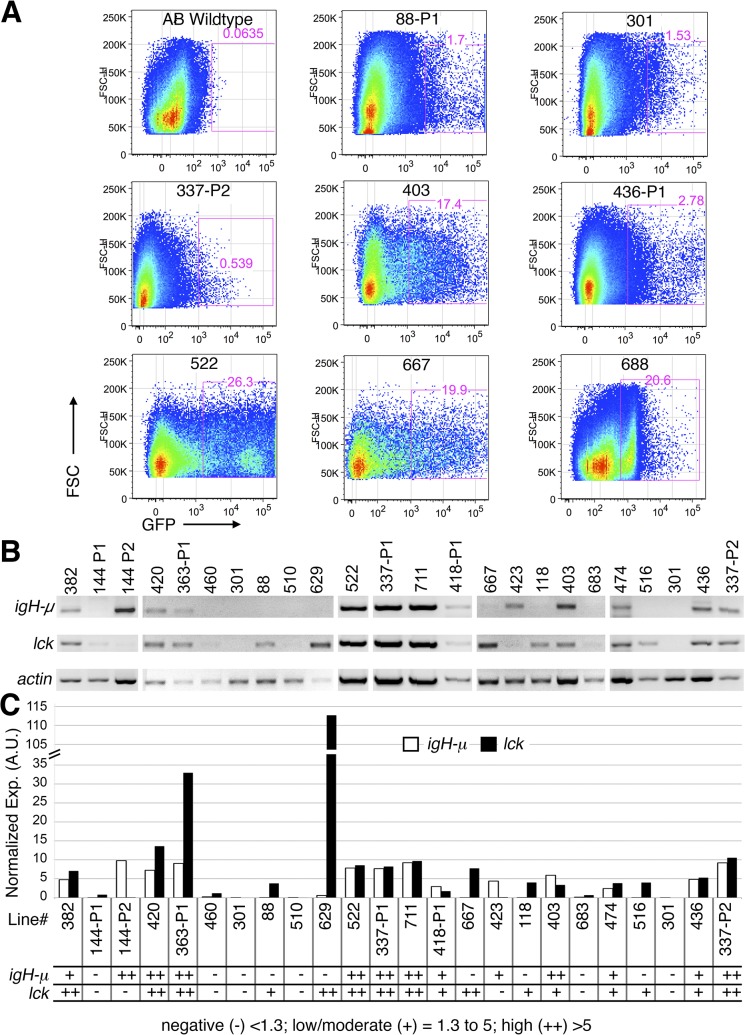
Fig 3. Identification of GFP populations that express T and B cell markers in young adult fish.
(A) Examples of scatter plots from fluorescence-activated cell sorting (FACS) of GFP+ cells from the indicated Tg(GBT-B4)fcc lines. Plots show GFP versus forward scatter (FSC, indicates cell size). The AB wildtype is a negative control. The line name and percent positive GFP cells out of the total events is indicated for each plot. (B) RT-PCR analysis of igH-μ, lck and ß-actin in GFP+ cells from the indicated Tg(GBT-B4)fcc lines. Lanes lacking an actin signal are not shown; vertical separation indicates independent experiments. Duplicates of fcc301 are shown (B-C). (C) Quantification of igH-μ and lck expression in GFP+ cells from the indicated lines. A.U. = arbitrary units. The scoring scale is listed below the results.

