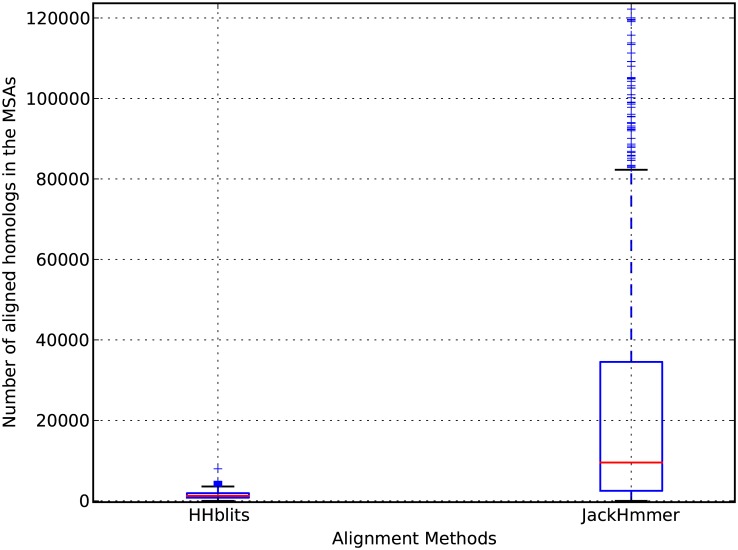
Fig 4. Comparison between the distribution of the number of homologs retrieved with HHblits and JackHmmer.
This boxplot shows the distributions of the number of homologs optimal for PhyloCys (HHblits alignments, on the left) versus the ones required by MIp and ICOV (JackHmmer alignments, on the right).

