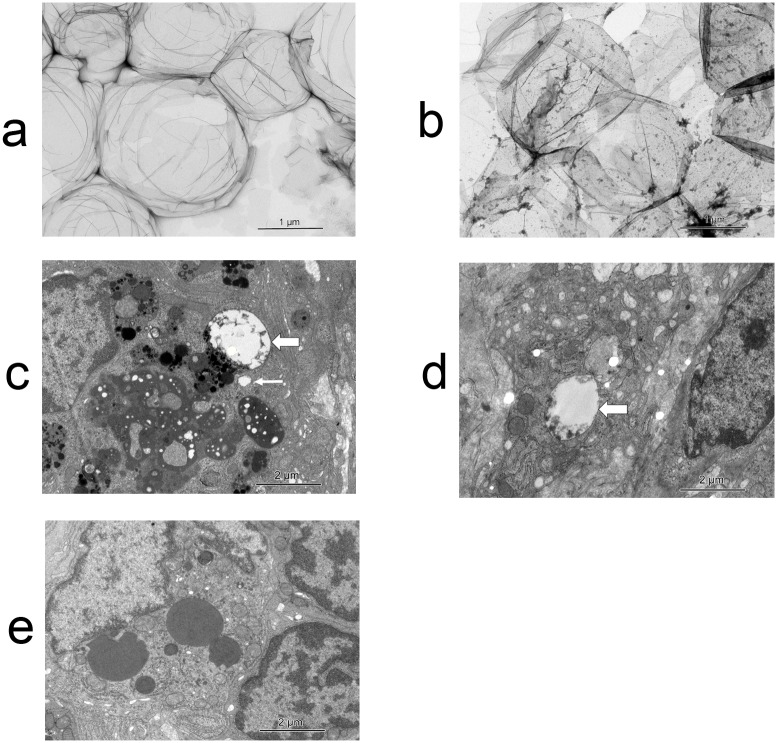
Fig 4. Transmission electron microscopy (TEM) images.
a. Negative stain of Sonazoid. The particle size of Sonazoid was around 1 to 2 μm. b. Negative stain of the tracer mixture. ICG particles were extremely small compared to Sonazoid. Sonazoid and ICG were mixed well with no separation. c. There were many vacuoles in the macrophages in the rabbit experiment. The vacuoles contained Sonazoid. Almost all the vacuoles in the macrophages contained some small particles, which may have been ICG. The size of the vacuoles was variable. The bold arrow shows the biggest vacuole, which keep the size when injection, and the thin arrow indicates an intermediate-sized vacuole. d. Some of the vacuoles in the lymphocytes from the swine experiment contained ICG. The arrow shows a big vacuole containing ICG. e. There were no vacuoles in the macrophages in the untreated rabbit’s LN. We show this picture as a negative control. The LN was dissected from a rabbit that was not given the tracer.

