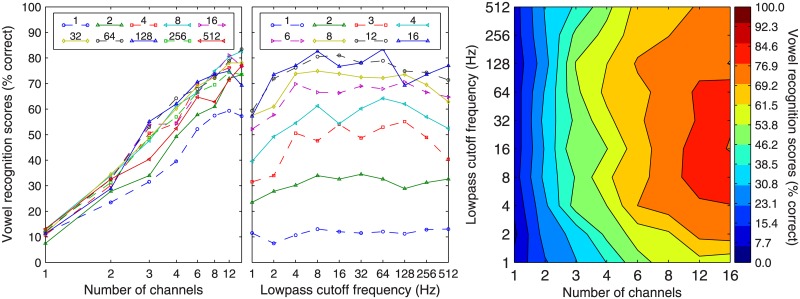
Fig 2. Group mean performance in Korean vowel recognition.
Data represent the average of all 11 subjects. In the left panel, different lines represent data for different lowpass cutoff frequencies (Hz) as indicated in the figure legend. In the middle panel, different lines represent data for different numbers of channels. In the right panel, contours filled with particular colors represent certain levels of vowel-recognition performance (see color bar on the right) as a function of the number of channels (abscissa) and the lowpass cutoffs (ordinate).

