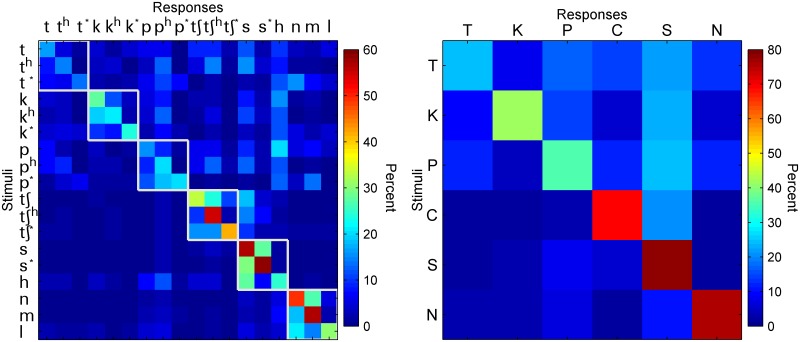
Fig 3. Confusion matrix of consonant recognition using data pooled across the 80 vocoder conditions (N = 11).
Left panel represents confusion matrix of individual consonants. The white squares represents groups of consonants categorized on the basis of phonetic features such as the place of articulation, manner of articulation, sonorant. The y-axis represents the target consonants while the x-axis represents the recognized consonants. The value in the cell of row j and column k is the percent of times stimulus j was recognized as k. The color of each cell with reference to the color bar on the right represents the value of response percentage. Right panel represents confusion matrix of six macro categories of “T”, “P”, “K”, “C, “S”, and “N” with each of the macro categories corresponding to a white box shown in the left panel.

