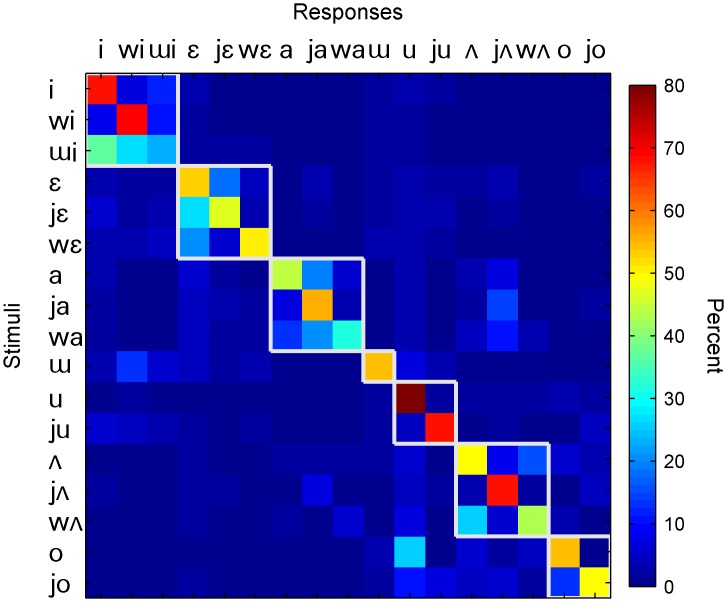
Fig 4. Confusion matrix of vowel recognition using data pooled across the 80 vocoder conditions (N = 11).
The white squares indicate groups of vowels categorized on the basis of their nucleus. The y-axis represents the target vowel while the x-axis represents the recognized vowel. The value in the cell of row j and column k is the percent of times stimulus j was recognized as k. The color of each cell with reference to the color bar on the right represents the value of response percentage.

