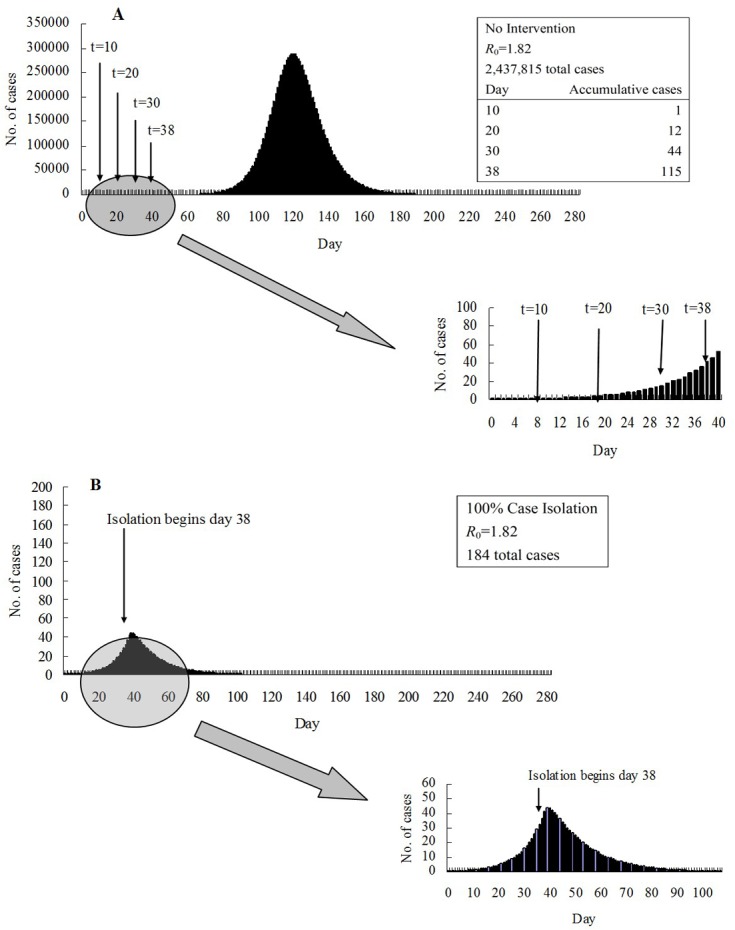
Fig 3. Model simulations.

(A) A typical large simulated influenza epidemic with no intervention and R 0 = 1.82. Also shown are the main intervention initiation times that were considered and the number of cases at those intervention times. (B) A typical simulated influenza epidemic which is contained using 100% case isolation initiated 38 days after the first case, when R 0 = 1.82.
