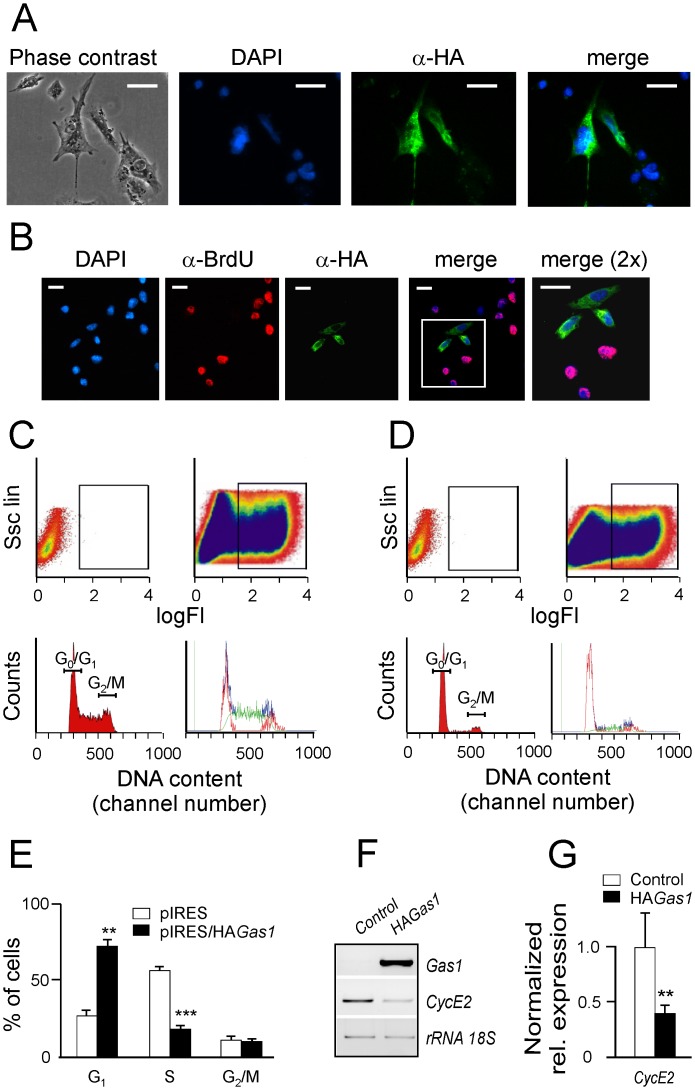
Fig 1. Transfection of Hepa 1–6 cells with the growth-arrest specific 1 (Gas1) gene.
(A) Anti-HA immunofluorescence of Hepa 1–6 cells transfected with pcDNA3/CAG-HAGas1 in the absence of detergents to preserve the integrity of membranes. Nuclei were counterstained with DAPI. (B) Double immunofluorescent staining anti-HA/anti-BrdU of Hepa 1–6 cells transfected with pcDNA3/CAG-HAGas1. (C) Cell cycle analysis of GFP-positive HEPA 1–6 cells after transfection with pIRES/GFP empty vector. 106 cells (areas indicated in the upper row) were sorted and subjected to cell cycle analysis after propidium iodide staining (lower row). (D) As (C), after transfection with pIRES/HAGas1. (E) Quantitation of the % of cells in the different stages of the cell cycle from the flow cytometry analysis. Experiments were done in triplicate. (F) Analysis of Ccne2 expression in Hepa 1–6 cells overexpressing Gas1. A representative RT-PCR showing Gas1 and Ccne2 expression in cells transfected with either empty pcDNA3/CAG (control) or pcDNA3/CAG-HAGas1 (HAGas1), 15 h after transfection. (G) qRT-PCR to determine CycE2 expression in cells as in (F). qRT-PCR was performed in triplicate from three independent experiments. Values were averaged and normalized to 18S rRNA. **, p<0.01. ***, p<0.001. In A and B the bar represents 11 μm.

