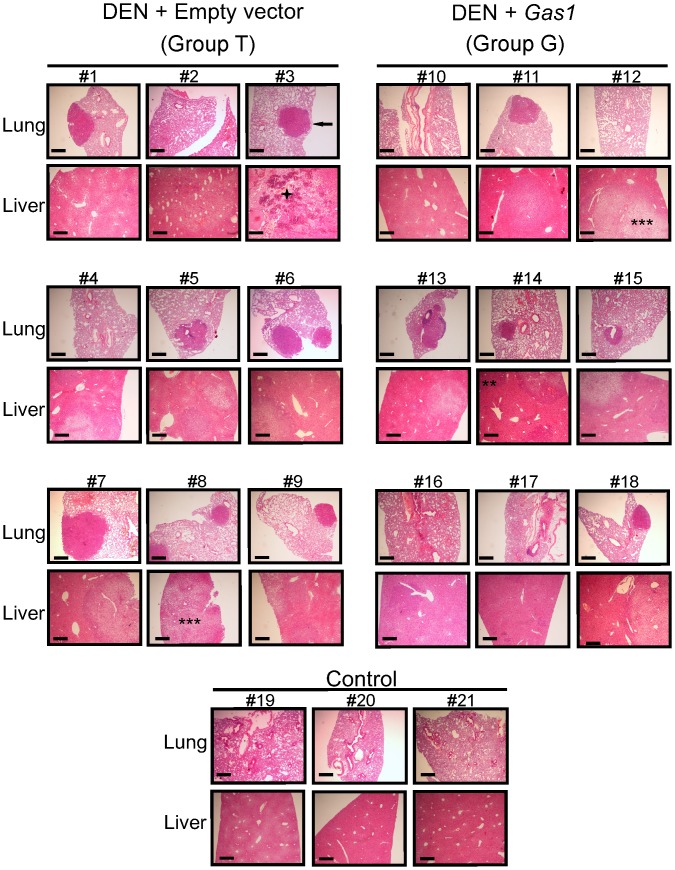
Fig 4. Histological analysis of livers and lungs.
Representative sections of lungs and livers from all the animals of groups T and G and from 3 animals of group C are shown. As an example, the arrow points to a metastatic nodule in the lung of mouse No. 3. In the livers, examples of hyperplastic (*), adenoma (**), carcinoma (***), and necrotic (+) areas are indicated. The horizontal size bar corresponds to 200 μm. All the samples were stained with hematoxylin-eosin.

