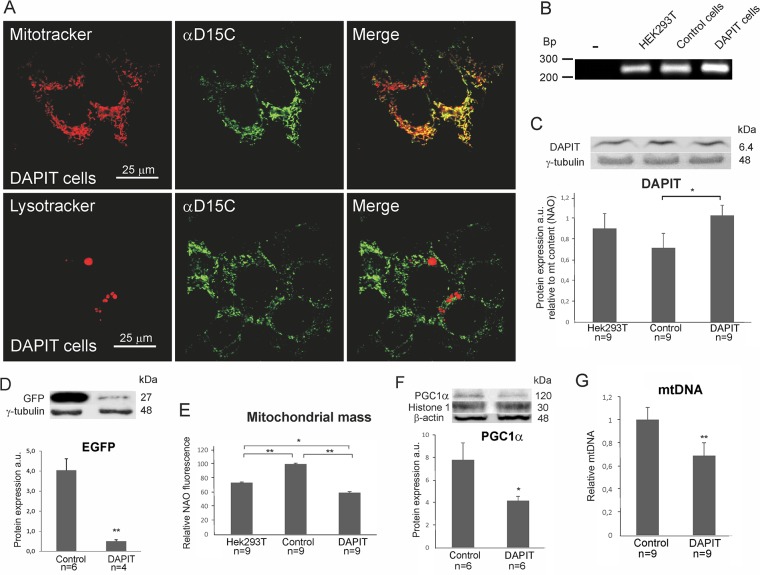
Fig 1. DAPIT over-expression decreased mitochondrial mass and mtDNA content in DAPIT cells.
(A) Representative confocal microscopy images of cells stained by Mitotracker and Lysotracker (100 nM, 10–30’, 37°C) and anti-DAPIT antibody, αD15C. (B) mRNA expression of the Usmg5 by semi-quantitative RT-PCR. Protein levels estimated by Western blot of (C) DAPIT and (D) EGFP. (E) Mitochondrial mass was measured by flow cytometry of NAO stained cells (200nM, 30’, 37°C). (F) Protein level of PGC1α from nuclear extract. (G) mtDNA content by quantitative PCR. The error bars are S.D. and asterisks indicate: *p<0.05, **p<0.01.

