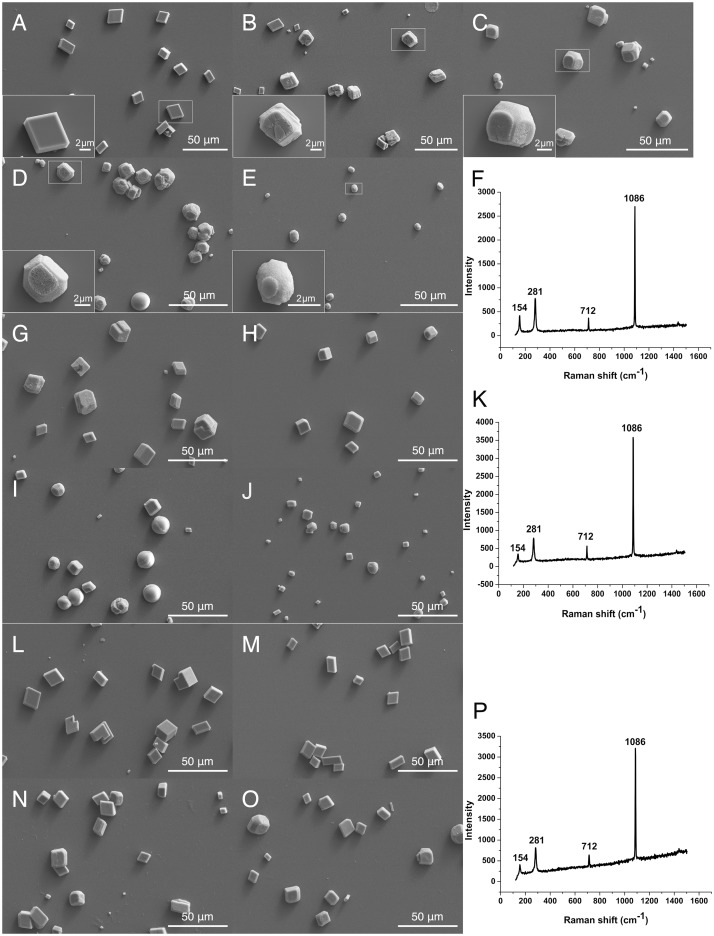
Fig 5. SEM images of in vitro crystallization of calcite in the presence of rKRMP-3, rBR, rGYR and Raman spectrum analysis of crystals.
Crystals were grown in the presence of 40 μg/ml GST (A), 2 μg/ml rKRMP-3 (B), 10 μg/ml rKRMP-3 (C), 20 μg/ml rKRMP-3 (D), 40 μg/ml rKRMP-3 (E), 2 μg/ml rBR (G), 10 μg/ml rBR (H), 20 μg/ml rBR (I), 40 μg/ml rBR (J) and 2 μg/ml rGYR (L), 10 μg/ml rGYR (M), 20 μg/ml rGYR (N), 40 μg/ml rGYR (O). The crystals in left bottom of the image are enlarged images of the boxed part, respectively. F, K, P showed the raman spectra of the crystals from 40 μg/ml rKRMP-3 (E), 40 μg/ml rBR (J), 40 μg/ml rGYR (O), respectively.

