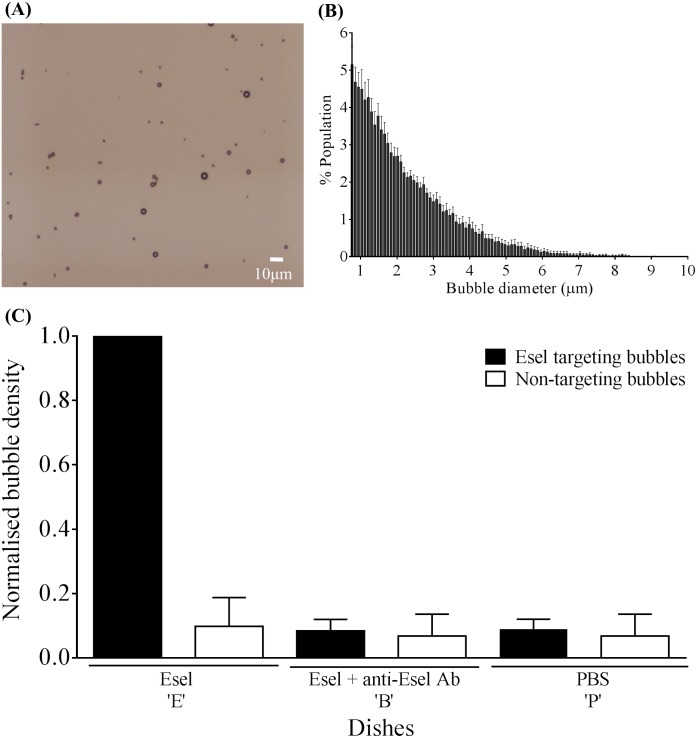
Fig 2. In vitro validation of Esel targeting microbubbles.
(A) Bright-field microscopy of Esel targeting bubbles. (B) Size distribution of Esel targeting bubbles. Plotted are the mean and SEM (error bar) for 5 batches of bubbles prepared on separate occasions. (C) In vitro binding of Esel targeting bubbles. Plotted are the mean and SEM (error bar) of attached bubble densities relative to that of Esel targeting bubbles on dish E, n = 5 batches of Esel targeting bubbles and 2 batches of non-targeting bubbles.

