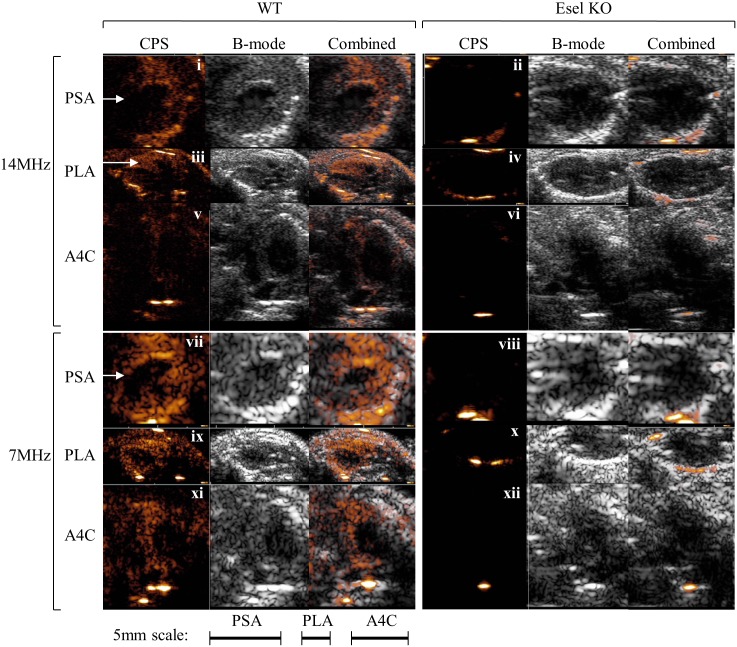
Fig 6. Real-Time Ultrasound Molecular Imaging of Esel Expression in the Mouse Heart.
PSA, PLA and A4C views of the heart at 14 and 7MHz CPS, >20min post bubble administration (when freely circulating bubbles have cleared from the blood pool (LV cavity)). Animal, gain and MI were the same between both frequencies. Bubble signal is presented in a heated object scale. Arrow indicates recovery of retained bubble signal in the mid anteroseptal wall by changing the scan plane from PSA to PLA or ultrasound frequency from 14 to 7MHz. Baseline images before bubble administration are shown in Fig B in S1 File.

