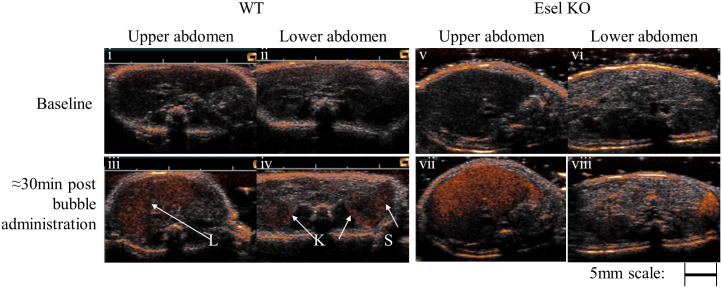
Fig 7. Real-Time Ultrasound Molecular Imaging of Esel Expression in the Mouse Abdomen.
Combined 14MHz ‘CPS-contrast only’ and ‘B-mode images’ before (i, ii, v, vi) and ≈30min post (iii, iv, vii, viii) bubble administration. ‘CPS-contrast only’ = bubble signal intensity in heated object scale. ‘B-mode’ = tissue signal intensity in grey scale. Arrows indicate the kidneys (K), liver (L), or spleen (S).

