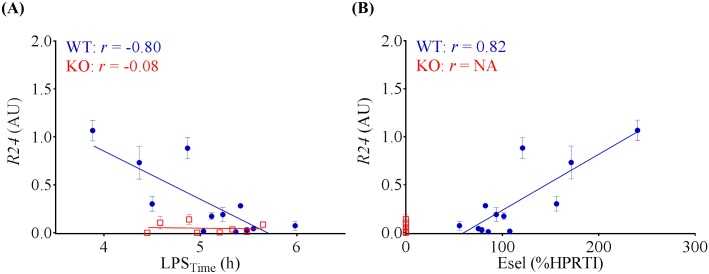
Fig 8. Acoustic Quantification of Esel Expression.
Acoustic signal intensity of targeted bubbles retained in the WT myocardium (R24) correlated with the level of Esel expression. WT (blue); KO (red); not applicable (NA). R24 is plotted as mean with SD (error bars). Pearson r (r) is shown. WT mean (SEM, range) = 0.32 (0.11, 0.01–1.07) AU, n = 12. KO mean (SEM, range) = 0.05 (0.02, 0–0.14) AU, n = 8.

