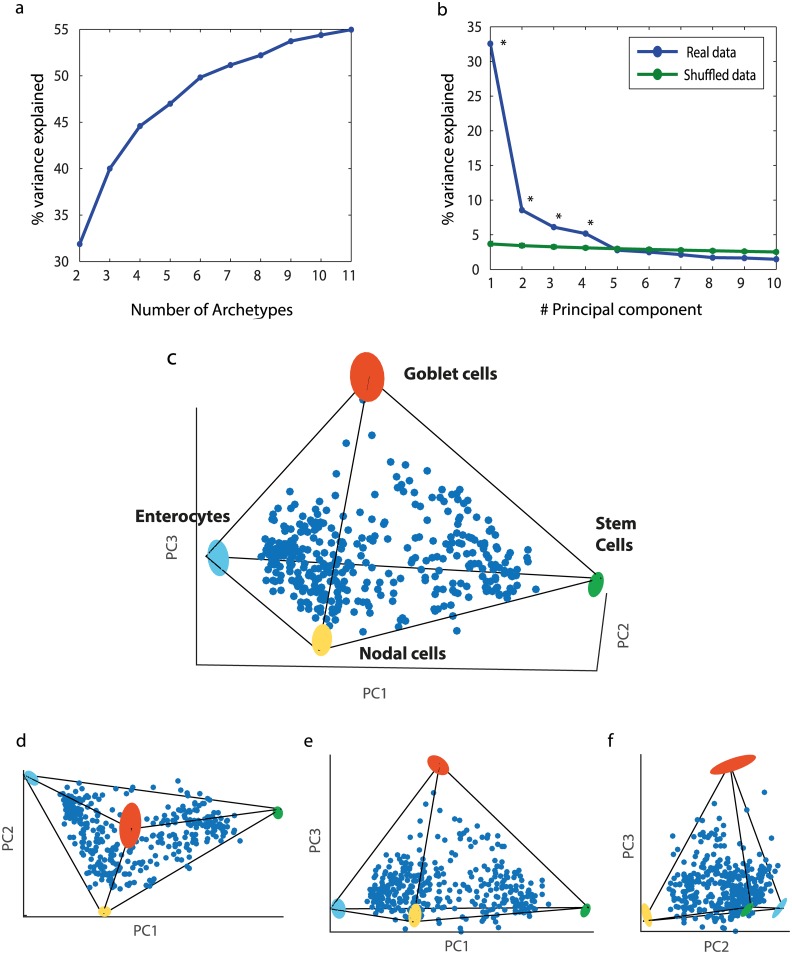
Fig 2. Human colon crypt cells fall in a tetrahedron in gene expression space.
(a) For k = 2–11 we found the k-polytope that best fit the data using PCHA algorithm, considering all 76 dimensions. Explained variance of best fit polytopes with k = 2–11 vertices begins to saturate at k = 4 or k = 5 vertices. (b) Comparison between the variance explained by the first k principal components of the data to the variance explained by the k principal components of shuffled data suggests that effective data dimensionality is three or four. Blue line: variance explained by PCA of intestinal data. Green line: variance explained by PCA of shuffled data. Points represent mean values. Error bars, representing 5%-95% variation intervals, are smaller than line width. Points for which the real data EV is higher than the randomized data EV are marked with *. (c) Data displayed in first 3 PCs axes resembles a tetrahedron, and its projections on principal planes (d)-(f) resemble triangles. Archetypes and their variation upon data resampling (bootstrapping) are shown as colored ellipses (see S1B Text). Thin lines—tetrahedron edges.

