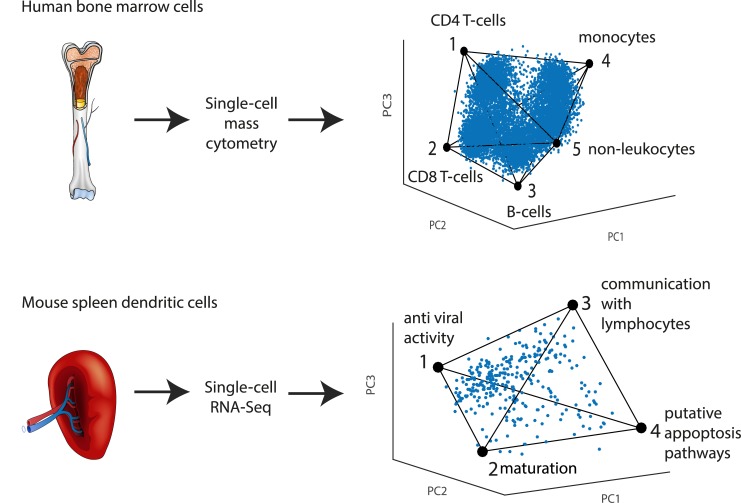
Fig 6. Different tissues analyzed by different single-cell technologies show polytopes and tasks.
(a) Human bone marrow cells analyzed by single-cell mass cytometry [13,25] in which proteins are detected using mass-tagged antibodies is well described by a 4D simplex (a polytope with 5 vertices). The simplex is shown projected on the first 3PCs, for other projections see S12c Fig. The archetypes correspond to cell types as indicated. Cell density peaks near each archetype. (b) Mouse spleen LPS stimulated dendritic cells analyzed by single-cell RNA-Seq [3] are well described by a tetrahedron. Archetypes are labeled with functions inferred from genes maximally enriched in cells near each archetype. For more details see S1G and S1H Text.

