Figure 2.

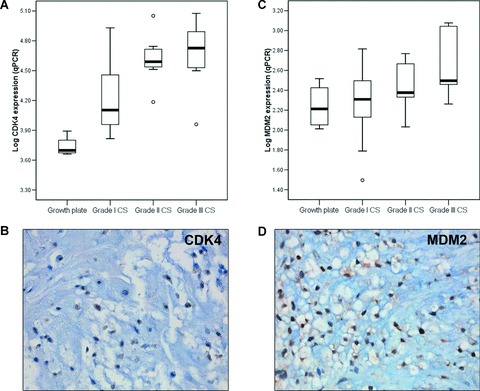
CDK4 (A) and MDM2 (C) mRNA expression levels relative to the growth plate are shown. Nuclear protein expression of CDK4 (B) and MDM2 (D) was determined (magnification 40×).

CDK4 (A) and MDM2 (C) mRNA expression levels relative to the growth plate are shown. Nuclear protein expression of CDK4 (B) and MDM2 (D) was determined (magnification 40×).