
Figure 1.
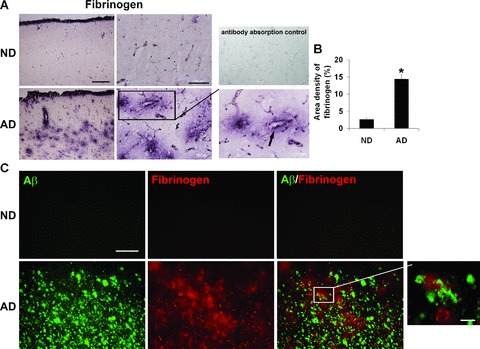
Fibrinogen immunostaining of tissues from the entorhinal cortex of non-demented (ND) and Alzheimer’s disease (AD) brain. (A) Low (left panels, scale bar = 500 μm) and high (right panels, scale bar = 100 μm) magnifications of fibrinogen immunoreactivity (ir). The lower right panel shows a detailed view of an AD section with arrow indicating fibrinogen ir in proximity to a blood vessel. The upper right panel is a representative image of an AD section stained with fibrinogen pre-absorbed with fibrinogen antibody. (B) Quantification of fibrinogen ir in ND (n= 7 cases) and AD (n= 8 cases) brain tissue; *indicates P < 0.05. (C) Representative double staining of fibrinogen with Aβ peptide deposits. Scale bar represents 200 μm. The magnified inset in the lower right panel (scale bar: 30 μm) shows a detailed view of an AD section indicating fibrinogen ir in proximity to peptide.