
Figure 5.
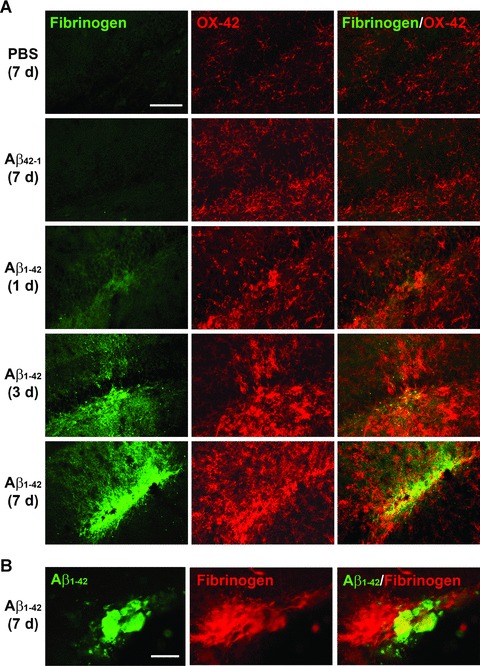
Fibrinogen and microglia (OX-42) double immunofluorescent staining in Aβ1-42-injected rat hippocampus. (A) In controls (7 days injection of PBS, upper panel or reverse peptide Aβ42-1, second panel) low levels of fibrinogen (left column) and numbers of microglia (middle column) are evident. The right column shows merged staining. Subsequent panels show progressive time-dependent changes in fibrinogen/OX-42/merged immunoreactivity for 1, 3 and 7-day durations of Aβ1-42 injection. Scale bar represents 200 μm. (B) Double staining for Aβ1-42 and fibrinogen (7 days after injection). Scale bar = 80 μm.