
Figure 5.
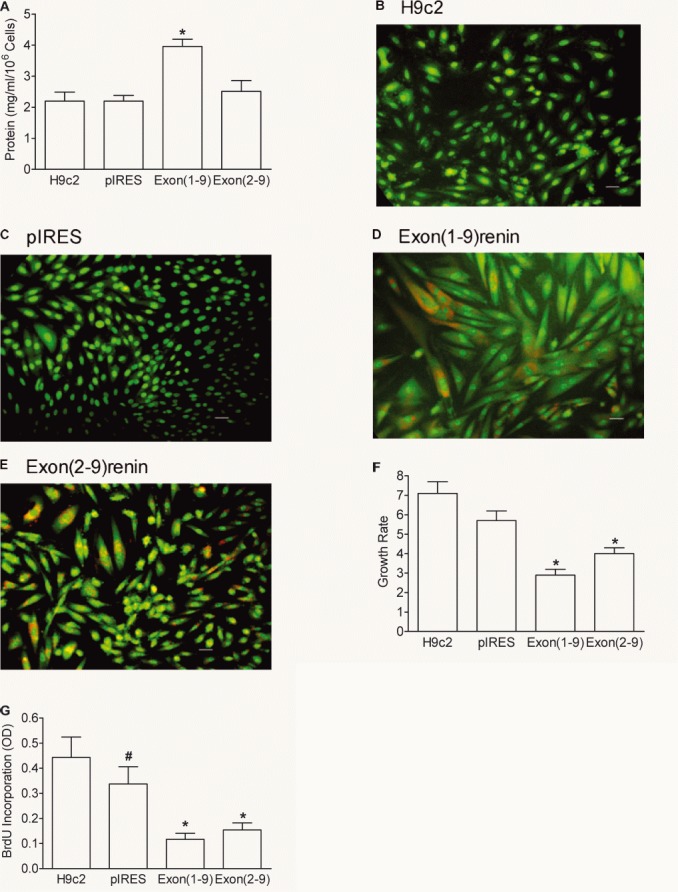
Protein content, fluorescence images, growth rate and proliferation of renin-transfected H9c2 cells. (A) Protein content; (B–E) fluorescence microscopy using the dyes acridine orange (green colour) and ethidium bromide (red colour) of renin-transfected H9c2 cells. Scale bar: 20 μm. Growth rate (F) was expressed as number of cells harvested after 7 days versus number of cells seeded. Proliferation rate (G) measured by the incorporation of BrdU into the DNA during a culture time of 1 day. n= 7 experiments. *P < 0.05 versus H9c2 and pIRES cells, #: P < 0.05 versus H9c2 cells.