
Figure 7.
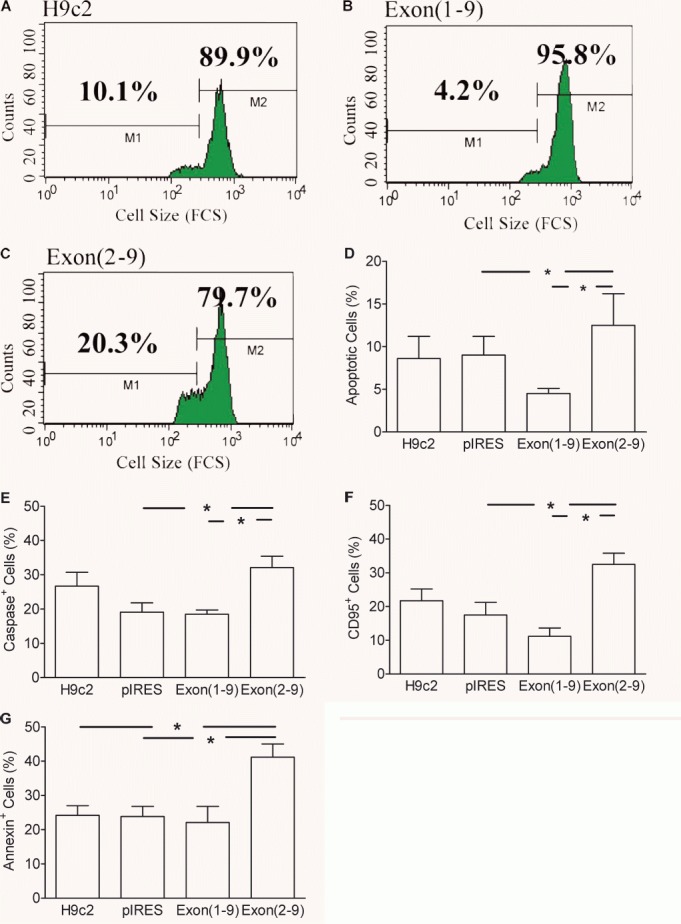
Apoptosis in (pro)renin transfected H9c2 cell lines. (A–D): Determination of apoptosis by means of cell shrinkage. A whole gate containing living and dead cells was evaluated using the FSC data as parameter of cell size. Culture time: 1 day. (A–C): One parameter histograms of the forward scatter (FSC) of one experiment. (D): mean ± S.E.M. of n= 7 experiments. (E): caspase activity; (F): expression of Fas antigen; (G): translocation of phosphatidyl serine to the outer membrane. (E–G): mean ± S.E.M. of n= 6 experiments. *: P < 0.05 versus pIRES control vector-transfected cells.