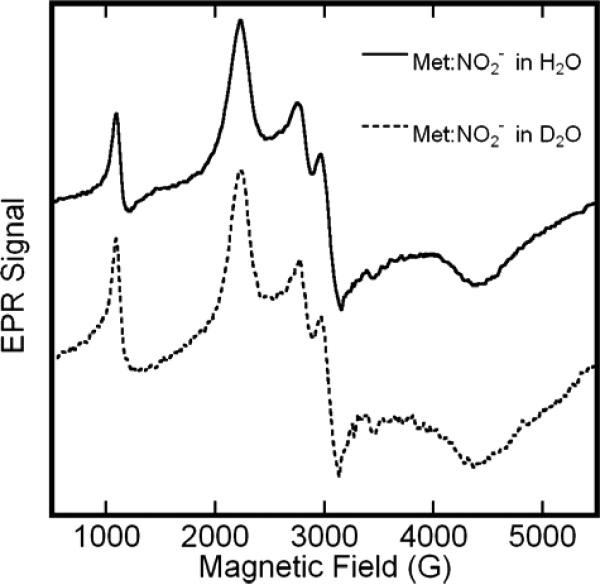
Figure 2.
EPR spectra of solutions of metHb:NO2− in H2O and D2O in boiling nitrogen (76K). The protein concentration was 0.5M in the H2O sample and 0.4M in the D2O sample. Both samples contained a twenty-fold molar excess (per heme) of NaNO2 m, and buffered at an effective pH of 7.4 in HEPES. Spectral amplitudes were corrected for difference in concentration. Both EPR spectra were recorded at 9.12 GHz with a 16.67 G/s sweep rate, a 0.5 s time constant, 5 G modulation amplitude, and 10 mW of microwave power.

