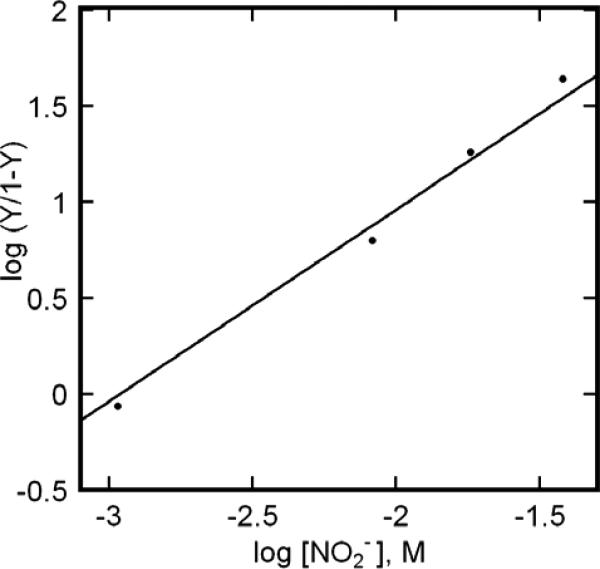
Figure 9.
Exemplary Hill plot summarizing the titration of metHb with NaNO2. The species concentrations used in the plot were obtained from detailed simulation of experimental EPR spectra. For the particular trial depicted in this plot, the protein concentration was 0.5 mM (pH 7.4 HEPES), with NaNO2 at, alternatively, one-, five-, ten- and twenty-fold excess over heme. Supporting data are provided in supplementary figures.

