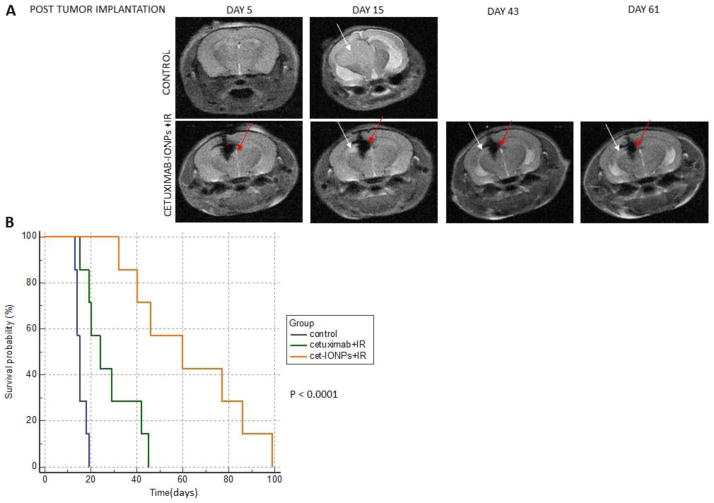
Fig. 5.
a Top: T2-weighted MRI of a control mouse implanted with EGFRvIII-expressing orthotopic human GBM xenograft (U87MGEGFRvIII) showing a hyperintense xenograft (white arrows) post tumor implantation. Bottom: Serial T2-weighted MRI of a mouse which underwent implantation of an EGFRvIII-expressing orthotopic human GBM xenograft (U87MGEGFRvIII) and subsequent CED of cetuximab-IONPs. Hypointense MRI signal drop after CED of cetuximab-IONPs (red arrows) and hyperintense EGFRvIII-expressing human GBM xenograft (white arrows). b Kaplan Meier survival curve comparison of athymic nude mice after intracranial implantation of U87MG EGFRvIII cells (2 × 10⁵/mouse) receiving no treatment (control group) or combination treatment by CED of cetuximab (0.3mg/ml) or cetuximab-IONPs (0.3mg/ml) and subsequent IR (10 Gy x 2)

