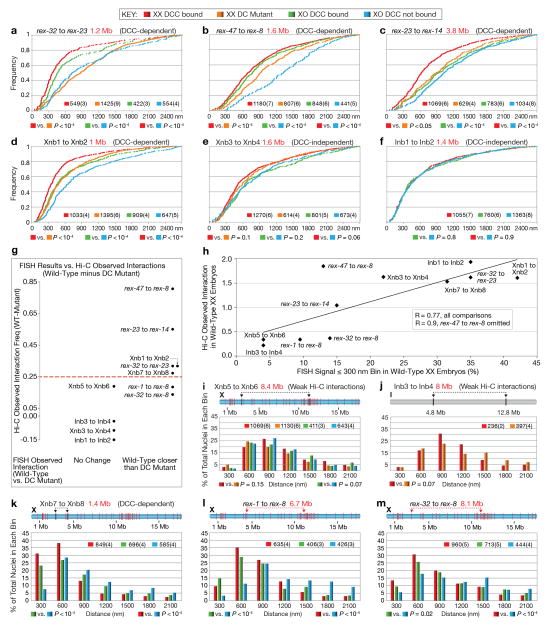
Extended Data Figure 9. Quantitative FISH shows that rex sites colocalize more frequently if the DCC is bound to X.
a–f, Data from histograms in Fig. 4b–g shown as cumulative plots. Number of nuclei and embryos (parentheses) assayed are shown (also for i–m). Distance between loci (red) and DCC dependence or independence of Hi-C interactions (black) are shown. P-values (chi-squared test) compare values in the 0–300 nm bin to those in 301–2700 nm bins. Same statistical analysis for (i–m). g, Correlation between DCC-dependent Hi-C interactions and DCC-dependent FISH colocalization. Y-axis, difference between wild-type and DC mutant Hi-C observed interaction frequency at 50 kb resolution. Higher number shows greater DCC-dependence. X-axis shows two categories defined by FISH: sites with unchanged colocalization frequency in DC mutant (DCC-independent) (left); sites with less frequent colocalization in a DC mutant (DCC-dependent) (right). Red dotted line, cutoff for calling a Hi-C interaction “changed” between wild-type and DC mutant. h, Scatter plot shows correlation between Hi-C and FISH data. Y-axis, Hi-C observed interaction frequency in 50 kb bins. X-axis, % colocalization (i.e. 300 nm bin) by FISH. R = 0.77 for all comparisons; R = 0.9 if the rex-47-rex-8 interaction is omitted. i–m, Histograms show quantification of 3D distances between two FISH probes. i, j, Distant loci on X or I with weak Hi-C interactions. k, DCC-dependent interaction between X sites lacking DCC binding. l–m, DCC-dependent interactions between distant rex sites.

