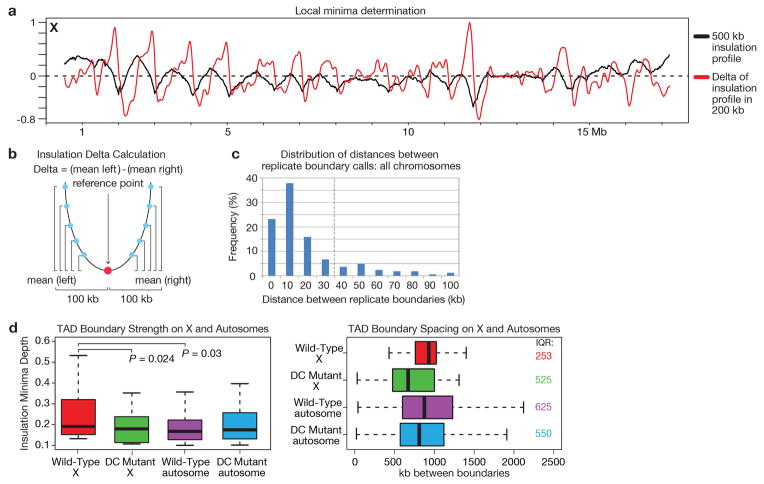
Extended Data Figure 3. TAD boundary analysis.
a, Insulation/Delta plot of the 10 kb binned wild-type combined replicate chromosome X Hi-C data calculated using a 500 kb insulation square size. The insulation profile is depicted in black. In red, the ‘delta’ vector is depicted. It is derived from the insulation vector using a 200 kb delta window (see insulation methods). The ‘delta’ vector is used to facilitate the detection of the valleys/minima along the insulation profile. b, Cartoon example showing how the delta vector is calculated from the insulation data vector. For each bin (reference point) the average insulation differences are calculated between all points up to 100 kb left of the reference point relative to the reference point. The same is repeated for all points up to 100 kb right of the reference point. The delta value is then defined as the difference between the mean (left difference) and mean (right difference). c, Bar plot shows the distribution of distances between boundary calls obtained with biological replicate Hi-C data across all chromosomes. Dotted vertical line indicates that +/− 30 kb was chosen for boundary definition, as it was the window in which the majority of replicate boundary calls (> 80%) overlap. d, Boxplots compare boundary strength (left) and spacing (right) in wild-type vs. DC mutant embryos. Wild-type boundary strength on X (defined as the distance from the insulation minimum to the largest neighboring maximum in the insulation profile) is higher than the DC mutant chromosome X boundary strength (P = 0.024) and higher than the boundary strength on wild-type autosomes (P = 0.03). TAD boundary strength on autosomes does not change in the DC mutant compared to wild-type (P = 0.979). Boundaries on X have less variance in spacing (interquartile range (IQR) = 253 kb) compared to the DC mutant (IQR = 525 kb) embryos. DC mutant X boundary spacing is more similar to the boundary spacing on the autosomes in wild-type (IQR = 625 kb) and DC mutant embryos (IQR = 550 kb).

